Rome Didn't Fall in A Day.


Objective Truth Exists and is Accessible to Everyone.

All Human Problems can be Solved with Enough Knowledge, Wealth, Social Cooperation and Time.


Photo: Rusty Peak, Anchorage, Alaska


Translate

Showing posts with label greenhouse gases. Show all posts

Thursday, August 11, 2022

Global Warming: How It Works

 I have a small collection on the bottom shelf of my bookcase of important books.  The books are: How Things Work (4 volumes), Roger Segalat, translated from German; The Way It Works, Robin Kerrod, 1980; The Way Things Work, translated from Italian, 1989; The Way Things Work, David McCauley, 1988; and two massive volumes on the history of science.  That’s what people do – we figure out how things work, and use that knowledge to understand and manipulate the world around us.  

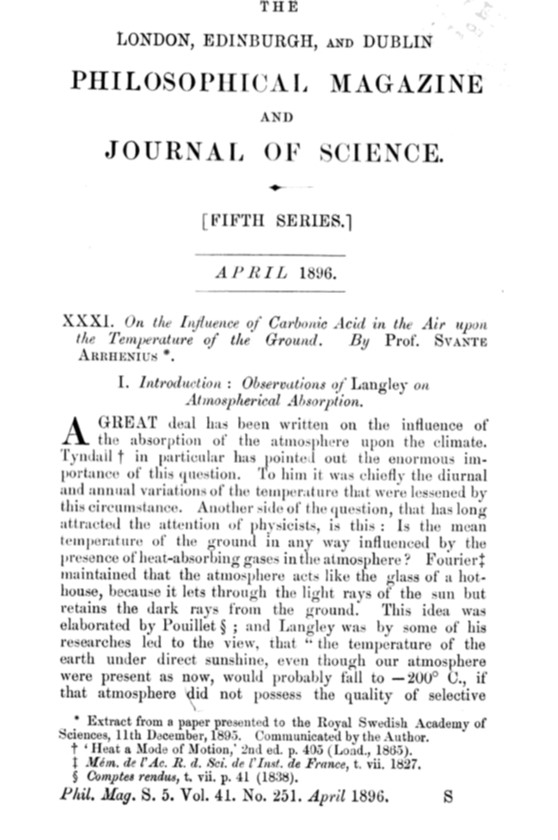
A friend recently asked me, “What is the best argument that a lot of current climate change is caused by humans, through fossil fuel CO2, methane, and other green house gases?  What are the best data and arguments?”   The most important point about climate science is that we know how it works.  It isn’t speculation or correlation.  We simply know how it works.  Since the 1860s or before, people have known that glass bottles filled with CO2 heat up faster than bottles filled with air.  In 1896, the brilliant Swedish chemist Arrhenius calculated how much the earth would warm if CO2 concentration was doubled.  This happened in the same decade that we invented the manual transmission and radio transmission of Morse code, and about a decade after Edison’s electric lightbulb.  Scientific research has continued since Arrhenius, and we know how the CO2 greenhouse effect works just as well as we know how an AM radio, manual transmission, or incandescent lightbulb works.  

We’ve observed and measured the processes that trap heat in the atmosphere and we’ve made predictions of future warming and related events.  To confirm or deny the theory of global warming, scientists set up a system of instrumentation across the planet and in orbit, beginning about 30 years ago.  The data are clear – oceans are warming from the surface downwards, ice is melting in every setting on the planet, and atmospheric temperatures are rising.  We’ve seen the primary predictions of global warming and second-order climate changes robustly confirmed.  Objections and challenges to the data and interpretation have been evaluated and refuted.

How It Works
The entire spectrum of electromagnetic radiation includes gamma rays, x-rays, ultraviolet, visible light, infrared, microwaves and radio waves.  The high-energy end of the spectrum consists of very short wavelengths, including gamma rays and x-rays through visible light, while the low-energy end of the spectrum has longer wavelengths, from infrared through radio waves.  

Everything radiates electro-magnetic radiation at some wavelength.  It’s called by several names –Planck radiation, black-body radiation, or thermal infrared radiation.  The kind of radiation emitted by objects depends on temperature.  Hot objects emit high energy radiation with short wavelengths, and cool objects emit low energy radiation with long wavelengths.  The sun primarily emits energy in the visible spectrum, because it is very hot.  Atmospheric gases are transparent to the visible spectrum, so most of the sun’s energy passes through our atmosphere to reach the ground.  Visible light strikes the earth’s surface and is converted to heat.  The warmed earth also emits radiation, but at a longer wavelength (infrared) because it is cool. The earth’s infrared radiation mostly escapes back into space.  Carbon dioxide, water vapor and methane, however, are partly opaque to infrared radiation, depending on the specific wavelength.  These gases trap heat in the atmosphere, warming the air, the oceans and the ground.  The phenomenon is called the greenhouse effect, because glass will do exactly the same thing, keeping a greenhouse warm – visible light goes in, but infrared radiation is trapped inside.  

Image credit: Science News.  The yellow lines are actual IR readings from space, compared to the theoretical Planck radiation from the ocean surface shown in dark blue.  Depressions and divots in the yellow lines represent absorption of upgoing IR radiation by various greenhouse gases, notably CO2.  Differences between the yellow lines represent clear and cloudy skies, with cloud tops having cooler temperatures and a different baseline Planck profile.

The natural amount of CO2 and water vapor in the air keeps the earth at a temperature to which we’ve  become adapted.  If the earth’s atmosphere had absolutely no CO2 or H2O, the earth’s average temperature would be about 33 C colder, causing freezing conditions over the entire planet.

Of the sun’s incoming radiation (341 W/m2), about 29% (100 W/m2) is directly reflected back into space, mostly by clouds.  The remaining 241 W/m2 is absorbed by the ground and atmosphere, warming the Earth.  The Earth radiates energy back into space at a wavelength in the infrared spectrum, balancing the energy input from the sun to create a stable climate for the past 6000 years.  But the addition of greenhouse gases to the atmosphere is currently trapping 0.94% (3.2 W/m2) of the sun’s energy reaching the surface.  That heat is ultimately redistributed to the oceans, ice, and air, warming the earth.


This figure simplifies many heat transfers within the atmosphere before energy is either retained on earth or returned to space.  The heat retained by greenhouse gases is given the awkward technical term "radiative forcing".

[Technical note: The sun's radiation, measured in space, has an intensity of 1364 W/m2.  There is a range of reported figures from 1361 W/m2 to 1368 W/m2, depending on the choice of instrument calibration.  The earth receives sunlight according to its cross-sectional area, equal to one-quarter of its surface area.  The earth emits radiation from its entire surface area.  So for a simplified energy budget as shown below, we have to choose a convention of adapting numbers for the cross-sectional area or the surface area of the earth.  Most displays adopt the convention of the whole earth surface area as I've done above.  This requires dividing the sun's input radiation by four, yielding 341 W/m2 to represent the average energy input across the entire earth.]

Under natural conditions, a balance develops between the incoming and outgoing radiation, which keeps the earth’s temperature stable, unless disturbed by other factors such as orbital variation.  The earth’s orbit varies over cycles of 40,000 years and 100,000 years, which triggers feedback mechanisms (including CO2 concentration and reflective ice) producing ice ages. 

Climate-change deniers are fond of saying "The climate has always been changing."  But since the last ice age, for the past 6,000 years, the climate has been stable, as proven by geological studies of sea-level, temperature-sensitive isotopes, and ice-sheet deposits.  This is the entire period of the written record of humanity.  The pre-industrial level of CO2 created a “Goldilocks” climate in which humans and nature thrived.


For the past 150 years, we have burned increasing quantities of fossil fuels – coal, oil and natural gas, and cleared or burned forests to create new farmland.

The CO2 emitted from these human activities has markedly changed the concentration of CO2 in the atmosphere, from the pre-industrial level of about 280 parts per million (ppm) of CO2, to the current level of 420 ppm CO2.  Because CO2 is such a potent greenhouse gas, this small change in atmospheric composition has a marked change in retained infrared radiation. 

You might not think that 400 parts per million is enough to change the retention of radiation in the atmosphere.  I’d like to propose a small thought experiment.  Four hundred parts per million is equivalent to four parts in ten thousand, or one part in 2,500.   One ounce of water contains about 600 drops.  Four and 1/6 ounces of water, about a half-cup, contains 2,500 drops.  Imagine, for a moment (or really try) putting one drop of opaque India ink or dark food coloring into a half-cup of water.  The ink noticeably reduces the visible light transmitted through the otherwise transparent water.  It’s the same with CO2 in the atmosphere.  

Climate Feedbacks
There are further processes known as feedback mechanisms affecting the earth’s heat budget.  Feedbacks are processes that are triggered by changes in Earth’s temperature, which either amplify (positive) or diminish (negative) the primary changes.  The strongest feedback effect is the Planck effect, a negative feedback.  As the Earth’s temperature rises, it radiates energy more strongly, counteracting the influence of greenhouse gases.  The balance between the sun’s incoming energy and the Planck effect is what caused the Earth to settle at a stable temperature.  The second strongest feedback is water vapor.  As the ocean surface becomes warmer, the equilibrium humidity in the air rises.  Also, warmer air can hold more humidity, keeping additional water vapor in the air.  Higher humidity is a positive feedback mechanism, because water vapor is itself a powerful greenhouse gas.  So as the planet warms, more heat is retained by water vapor.  As Arctic snow and ice melt, the surface reflectivity diminishes, causing positive feedback.  Climate change increases cloudiness, causing feedback effects.  Clouds are complex as a feedback mechanism, with both positive and negative impacts.  Depending on the type of cloud, the primary impact may be to reflect sunlight, or may be to retain infrared emissions from earth.  Overall, clouds are considered to be a positive feedback.  There are more complex feedbacks involving biochemistry and methane, and fast versus slow feedbacks, but these are generally an order of magnitude less significant than the physical feedbacks.  This is an area of active climate research.

The Planck effect dominates all other feedback mechanisms, and the total impact of all feedback effects is negative.  This is very good, because a simple modeling exercise shows that the global climate would soon irreversibly blow up if the total feedback were positive.  Nevertheless, there are number of authoritative sources on climate feedbacks (notably Wikipedia and Andrew Dessler’s Modern Climate Change) that neglect to mention the Planck effect among climate feedbacks and assert that the net climate feedback is positive.  This is incorrect.

Global temperature change since pre-industrial times is about 1.1 C, so the current total feedback is -1.3 W/m2.  Combining the greenhouse gas effect with total feedback leaves a positive (warming) climate influence of 1.9 W/m2.  

Validation
Climate science predicts that the earth should be warming, due to heating resulting from the buildup of greenhouse gases.  These greenhouse gases, particularly CO2, are unquestionably from human activities (see my blog post, https://dougrobbins.blogspot.com/2019/12/understanding-source-of-rising.html).  We have detailed temperature records for much of the world for the past 150 year or so, and we have plentiful temperature measurements of the oceans beginning in about 1950.  However, early climate data have a few issues with data quality and coverage.

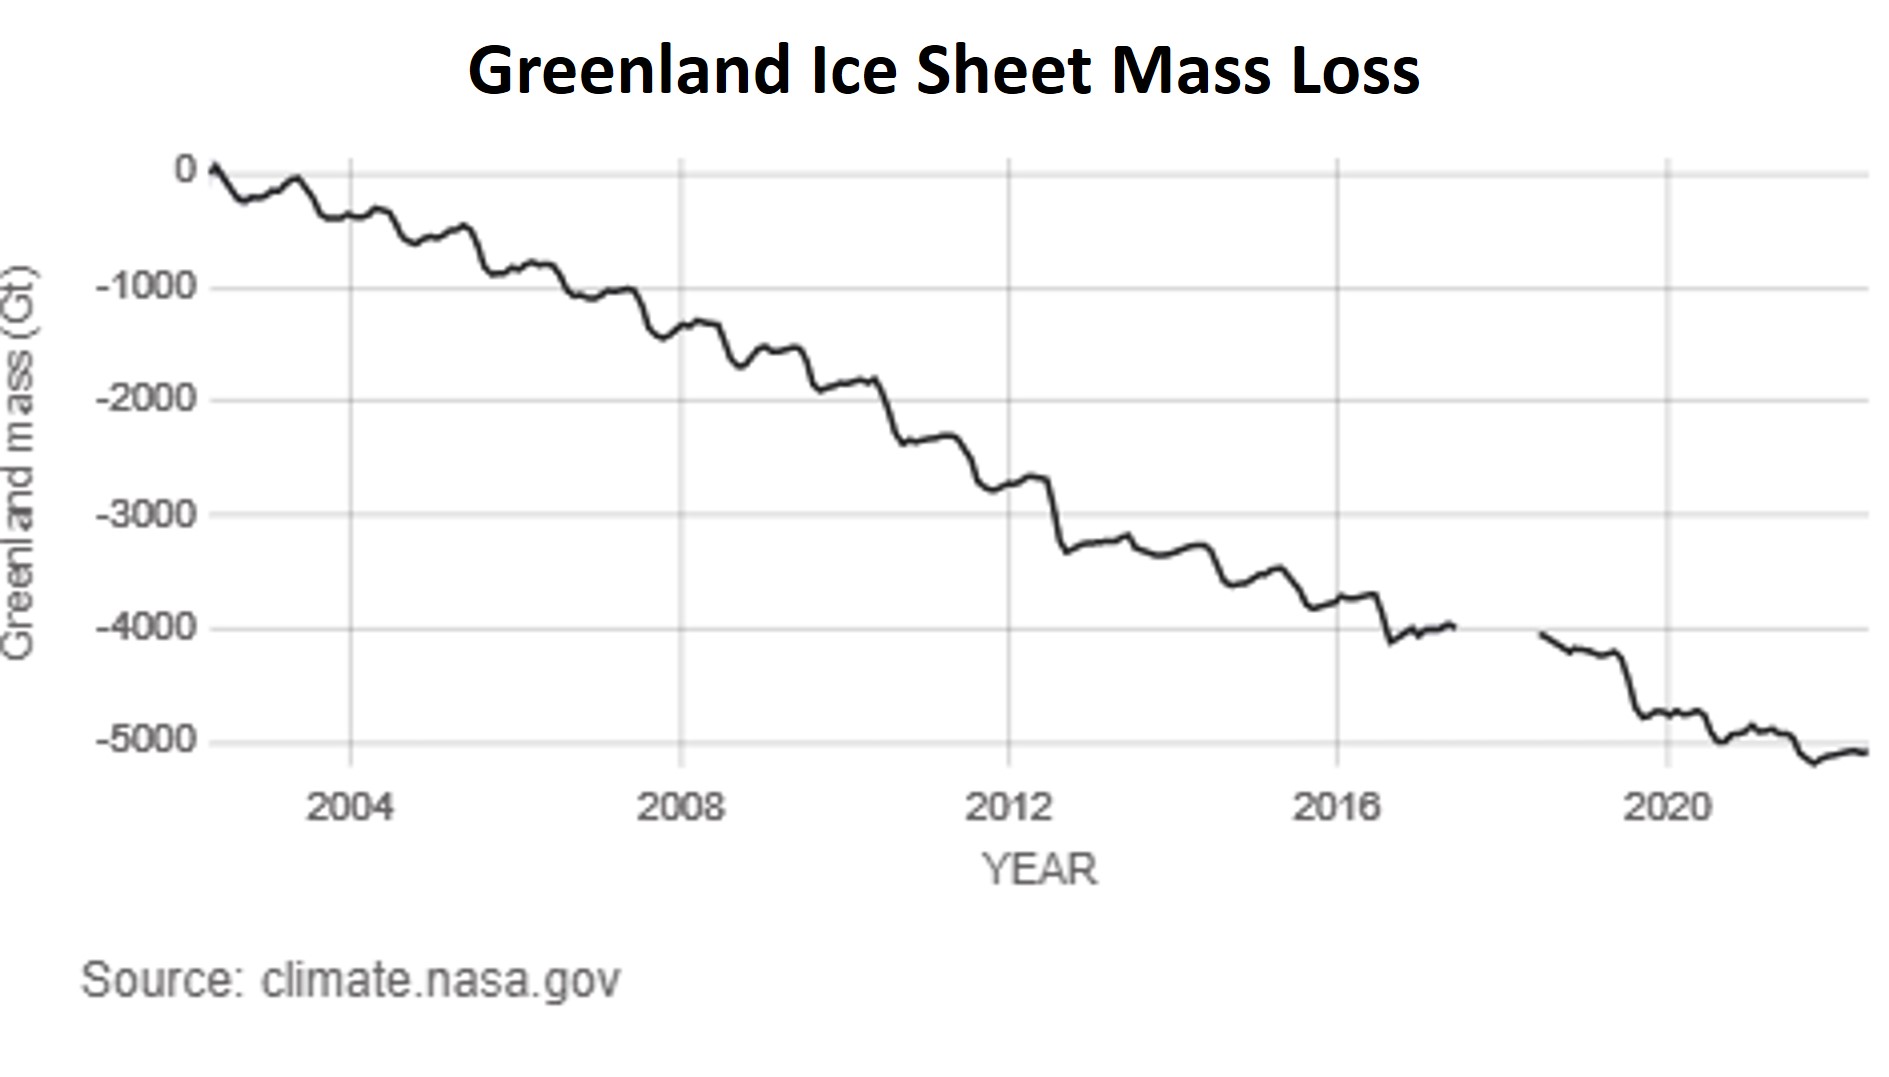
Starting around 1990, scientists put in place a comprehensive set of instrumentation specifically designed to detect and measure global warming.  These systems have corrected some of the issues of data collection from early research, and provide unprecedented coverage of our planet.  The results are unequivocal.  The oceans are warming from the surface downwards; the air is warming over the oceans; the air is warming more rapidly over land; the Arctic is warming faster than the rest of the planet; and continental glaciers, Arctic sea ice, and the Greenland and Antarctic ice caps are melting.  Other, second order effects of the heat are well-proven also, including an acceleration of rising sea level and seasonal changes in physical and biological systems.

There is simply no point to denying that global warming and resulting climate changes are happening due to human emissions of greenhouse gases.  These changes are observed to be accelerating, as expected, due to higher concentrations of greenhouse gases.  Previous predictions about climate change have been highly accurate.  There is no reason to doubt further predictions of serious to catastrophic harm from future climate change unless we greatly curtail emissions of greenhouse gases.

Appendices
Appendix 1
Climate change indicators and sources
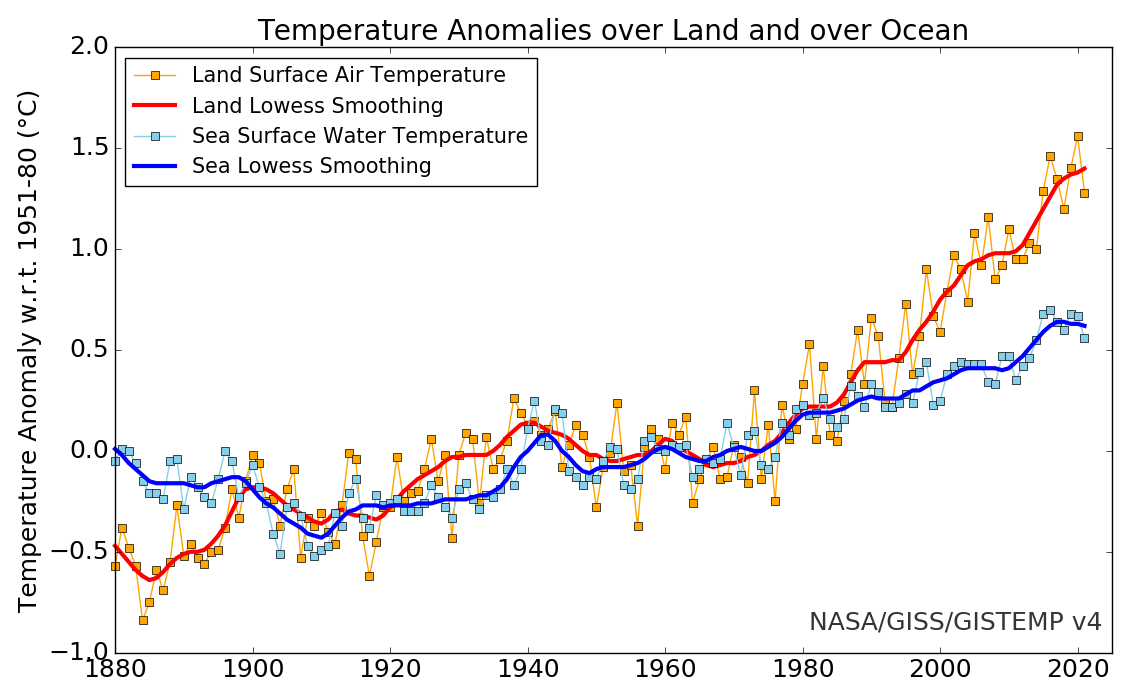
Air Temperature Over Land and Oceans
https://data.giss.nasa.gov/gistemp/graphs_v4/

Temperature Anomaly Map, 2016-2022 vs. 1951-1980
Note Arctic warming is more intense than the rest of the planet, as predicted by the Macdonald report in 1979.  Also note that air over land is warming faster than air over oceans.
https://data.giss.nasa.gov/gistemp/maps/
Continental Glaciers, World Glacier Monitoring Service
https://wgms.ch/global-glacier-state/

Arctic Sea Ice Extent (July)
http://nsidc.org/arcticseaicenews/
Antarctic and Greenland Ice Sheets
https://climate.nasa.gov/vital-signs/ice-sheets/


Appendix 2, Comparison of Descriptions of Greenhouse Gas Heating
Arrhenius, 1896
“The selective absorption of the atmosphere is…of a wholly different kind [than diffusion of ultraviolet radiation]. It is not exerted by the chief mass of the air, but in a high degree by aqueous vapour and carbonic acid [CO2], which are present in the air in small quantities.  Further, this absorption is not continuous over the whole spectrum, but nearly insensible in the light part of it, and chiefly limited to the long-waved part, where it manifests itself in very well-defined absorption-bands, which fall off rapidly on both sides.  The influence of this absorption is comparatively small on the heat from the sun, but must be of great importance in the transmission of rays [thermal infrared, or long-wave radiation] from the earth.” 
Arrhenius then describes the debate over whether water vapor or CO2 has the greater influence as a greenhouse gas. 

Asimov, 1959
"The light rays of the Sun hit the air, pass through a hundred miles of it, hit the surface of the Earth, and are absorbed. The Earth heats up.  The heated Earth radiates energy at night back into space, in the form of the far less energetic infra-red.  This also passes through the atmosphere.  The warmer Earth grows, the more heat is radiated away at night.  At some particular equilibrium temperature, the net loss of radiation by Earth at night equals that gained by day so that, once the temperature (whatever it is) is reached, the Earth as a whole neither warms nor cools with time.
Carbon dioxide, however, introduces a complication.  It lets light rays through as easily as do oxygen and nitrogen, but it absorbs infra-red rather strongly.  This means that Earth’s nighttime radiation finds the atmosphere partially opaque, and some doesn’t get through.  The result is that the equilibrium temperature must rise a few degrees to reach the point where enough infra-red is forced out into space to balance the Solar input.  The Earth is warmer (on the whole) than it would be if there were no carbon dioxide at all in the atmosphere.  The warming effect of carbon dioxide is called the “greenhouse effect”.
…A recent set of calculations indicate that if the present carbon dioxide level should double, the overall temperature of the Earth would rise by 3.6 C."
Asimov was reporting on the work of G.N. Plass, published in 1958. 

Ramaswamy, 2019
“Interactions of the incoming solar radiation and outgoing longwave radiation with Earth’s surface and atmosphere affect the planetary heat balance and therefore impact the climate system.”

Also see:
Ramaswamy, Radiative Forcing of Climate Change, 2001

Ramaswamy, Radiative Forcing of Climate: The Historical Evolution of the Radiative Forcing Concept, the Forcing Agents and their Quantification, and Applications, 2019

R. J. Bantges & H. E. Brindley, On the Detection of Robust Multidecadal Changes in Earth’s Outgoing Longwave Radiation Spectrum, 2016

A. Dessler, Modern Climate Change, Third Edition, 2022

IPCC Reports, Technical Summaries, various dates.

Appendix 3, Discussion of Climate Feedback Discrepencies
Wikipedia asserts that there is a net positive feedback to warming.  However, a check of the referenced IPCC Technical Summary for AR5 (2014) is less clear and does not explicitly mention Planck radiation, the strongest negative feedback.  Andrew Dessler’s Modern Climate Change also concludes that total feedbacks are positive.  Dessler also does not mention Plack radiation as a feedback parameter.  [Dessler quantifies the total feedback relative to radiative forcing, rather than temperature change, which makes direct comparison of the feedback numbers a little more difficult.]  On the other hand, Global Climate Models, by D.L. Hartman, clearly identifies each feedback component, including Planck radiation.  Hartman states “the best estimate of the total feedback is about −1.2 ± 0.6 W m−2 K−1, but it is uncertain by about ±50%.”   The IPCC AR6 preliminary Technical Summary also concludes that total physical feedbacks are negative, with a best value of about -1.2 ± 0.7 W m−2 K−1.  I think that the value of -1.2 W m−2 K−1 is likely to be the best estimate.

References:
Svante Arrhenius, On the Influence of Carbonic Acid in the Air upon the Temperature of the Ground, 1896.
https://www.rsc.org/images/Arrhenius1896_tcm18-173546.pdf

Isaac Asimov, "No More Ice Ages?", 1959
In Fact and Fancy, 1972

Ocean heat content, NOAA
https://www.ncei.noaa.gov/access/global-ocean-heat-content/ 

ARGO Ocean Temperature Program Homepage
https://argo.ucsd.edu/ 

NOAA Annual Greenhouse Gas Index
https://gml.noaa.gov/aggi/aggi.html 

Lambeck et al, Sea level and global ice volumes from the Last Glacial Maximum to the Holocene, 2014
https://www.pnas.org/doi/10.1073/pnas.1411762111

Doug Robbins, atmospheric CO2 and related charts, 2022.
http://dougrobbins.blogspot.com/2022/04/charts-of-atmospheric-co2-carbon.html 

NASA GISS Annual Mean Temperature over Land and over Oceans
https://data.giss.nasa.gov/gistemp/graphs_v3/

G. Macdonald, JASONs presidential science advisory report, excerpt, 1979.
https://climatestate.com/2019/07/10/the-jason-report-the-long-term-impact-of-carbon-dioxide-on-climate-1979/
Whole report:
https://irp.fas.org/agency/dod/jason/co2.pdf 

Dennis Hartmann, Global Climate Models, 2016 (feedback chart)
https://www.sciencedirect.com/topics/earth-and-planetary-sciences/climate-feedback
IPCC AR6 Technical Summary (feedback chart, pg. 96)
https://www.ipcc.ch/report/ar6/wg1/downloads/report/IPCC_AR6_WGI_TS.pdf

Andrew Dessler, Introduction to Modern Climate Change, Third Edition, 2022

Sunday, August 15, 2021

Global Warming, Natural Cycles and Unicorn Farts

 "The suggestion that natural causes are contributing to global warming is entirely speculative.  If someone proposes that natural causes are warming the earth, they need to identify, observe and quantify the specific process that is occurring.  It may be true that unicorn farts, rather than greenhouse gases, are warming the earth over the past century.  But the burden of proof is on the unicorn advocates.  They need to find the unicorns, observe and measure the heat generated per unicorn fart.  They need to demonstrate that unicorn farts are sufficient to account for a significant portion of global warming, and to either discredit the physics of greenhouse gases or to identify a previously undetected heat sink on the scale of the global ocean to account for the displacement of greenhouse gas heat.  They also need to demonstrate that unicorn farts are delivering heat to the surface of the ocean and cooling the stratosphere.  The notion that “we just don’t know what is warming the earth” is not a viable statement.

I recently had a call with a staffer for Alaska’s more conservative U.S. Senator.   I had made a trip to DC, and Alaska’s Congressional Delegation will usually make time to meet with constituents who travel 3350 miles from home.   I had sent meeting requests to both Senators, and the moderate Senator’s staff contacted me, and we had a good discussion of climate change.  The more conservative Senator’s office contacted me after I sent a complaint comparing their non-responsiveness to the moderate Senator.  In my call with the staffer, I discussed the points on my agenda:

1) That we needed to cut CO2 emissions 50% by the year 2035 and to zero by 2050, to avoid a climate disaster. 

2)  Achieving those cuts will be very difficult and costly.  Real climate solutions need to be affordable, scalable, timely, environmentally acceptable, and technologically mature.  There are no currently viable solutions, as global upscaling of renewable energy runs into problems with increasing costs and timeliness. 

3)  We cannot count on negative emissions technologies to provide a climate solution due to similar issues with global scaling of these technologies. 

4)  Historically, the United States disproportionally contributed to the climate crisis, and we will be held responsible, accountable, and liable for damages to other nations in the future. 

5)  Because we are disproportionally to blame, we are morally obligated to lead the world in reducing emissions. 

6)  In the case of south-central Alaska, replacing our fossil-fuel electrical generation will require about 1000 new wind turbines, plus short-term and seasonal energy storage.  Powering a full fleet of electric vehicles will require at least another 1000 wind turbines, and replacing space heating by fossil fuels will require at least another 1000 wind turbines, all to be accomplished by 2050.  For reference, building an 11-turbine wind farm near Anchorage required a decade of planning and two years of construction.

7) A carbon tax is the best way to meet emission reduction goals, starting small, and increasing until renewable energy or carbon sequestration is commercially justified.

The staffer listened politely to my sermon, at points offering small interjections.  He commented that the Senator sponsored legislation to reduce the permitting obstacles to building more wind turbines.  I responded that it was a nice ideological gesture, but the real problem in building more wind energy wasn’t permitting, it was the availability of capital.  The great majority of cost for fossil-fuel generation is in fuel expense, which is spread out across the life of the power plant.  The great majority of cost for renewable energy is in capital, which must be funded up-front.  The staffer added that it was an exciting time for renewable energy; and that there was much interest and activity in Congress for doing more.

At the end of our conversation, I took issue with one of the Senator’s canned response letters regarding climate change.  The Senator’s previous position was that we don’t know how much of climate change is due to human greenhouse gas emissions, and how much is due to natural factors.  I said that was false.  “It is?” questioned the staffer, sounding surprised.  “Yes”, I replied.  “That’s complete bullshit.  All of climate change is due to human influences; one hundred percent.  There are no natural processes or cycles that are adding heat to the earth to the degree and over the time frame that we have observed global warming.”  Shortly afterward, we concluded the call. 

In retrospect, I wasted a good opportunity to provide a real explanation to someone who could make a difference in forming policy.  In the fashion of introverts everywhere, here is what I should have said. 

Global warming is by now a well-quantified problem.  The physics of greenhouse gases has been understood for 125 years.  The physics of global warming has been well-quantified since the 1980s, when satellites began measuring incoming solar radiation, and outgoing radiation was measured at the surface, and at various altitudes up to the stratosphere, and later by satellites.  What was happening to that heat was still somewhat uncertain in the 1990s, but in the early 2000s instrumentation was devised to measure the temperature of the ocean to a depth of 2000 meters, and to monitor the mass of the polar ice caps, Arctic sea ice, and continental glaciers.  The system of measuring surface temperatures was also improved with the addition of satellite observations.  Considering all of this information, we now have twenty years of comprehensive measurements for the earth’s heat budget. 

The first point is that heat from greenhouse gases is fully sufficient to account for the heat now appearing in earth’s heat sinks, with an imbalance of only a few percent.   If a natural source of heating existed, it would raise another problem – what is happening to the heat from greenhouse gases?  In order to validate a natural source of heat, either the physics of greenhouse gases needs to be overturned (which isn’t going to happen), or we have somehow overlooked a heat sink on the scale of the global ocean.  This also is extremely unlikely. 

A second point is that any alternative explanation of global warming must also explain the pattern of heat flow.  Observations show that the oceans, which absorb more than 90% of the heat from greenhouse gases, are warming from the surface downwards.  This implies heating at the surface, either from increased solar radiation or by conduction from the atmosphere.  We have forty years of satellite observations of the solar radiation, conclusively proving that the solar radiation is declining slightly, not increasing.  Any speculative natural process for global warming must necessarily deliver heat to the surface of the ocean, from the atmosphere.  This rules out any speculative heat source involving ocean currents or cycles.

A final point is that there are no known natural systems adding new heat to the earth over the past five decades.  Geologists, oceanographers, and meteorologists have done a pretty good job over the past 200 years, identifying the processes operating on the earth's surface.  No process that would add new heat to the planet's surface, over the time that global warming has occurred, has been identified.  Natural systems do have some cyclicity that affect the global climate.  Ocean cycles generally operate over periods of a decade or less, not over the multi-decade time scale that we observe heat appearing in earth systems.  But one important thing to note is that these natural cycles are zero-sum; they redistribute heat but don’t add new heat to the earth.  As noted above, solar radiation varies according to the eleven-year solar cycle, but there is no continuing warming persisting beyond those cycles. 

The argument that natural causes are contributing to climate change is entirely speculative.  If someone is proposing that natural causes are warming the earth, they need to identify, observe and quantify the specific process that is occurring.  It may be true that unicorn farts are warming the earth, rather than greenhouse gases.  But the burden of proof is on the unicorn advocates, to find the unicorns, observe and measure the heat generated per unicorn fart.  They need to demonstrate that unicorn farts are sufficient to account for a significant portion of global warming, and to either discredit the physics of greenhouse gases or to identify a previously undetected heat sink on the scale of the global ocean, to account for the displacement of greenhouse gas heat.  They also need to demonstrate that unicorn farts are delivering heat to the surface of the ocean, and cooling the stratosphere. 

The notion that “we just don’t know what is warming the earth” is not a viable statement. 

References

Written testimony of climatologist Zeke Hausfather to the US House Committee on Space, Science and Technology, , p. 13, 3/12/2021  https://science.house.gov/imo/media/doc/Hausfather%20Testimony.pdf

“Our best estimate is that approximately all of the observed global mean surface temperature warming since the 1950s is due to human emissions of CO2 and other greenhouse gases. Natural climate “forcings” such as changing solar output, variations in the Earth’s orbit, and volcanic activity would have likely led to a slight cooling over the past 70 years in the absence of human influences on the climate.”  

IPCC 6th Assessment Report, Headline Statements from the Summary for Policymakers, 8/9/2021 (draft)  https://www.ipcc.ch/report/ar6/wg1/#SPM

“A.1 It is unequivocal that human influence has warmed the atmosphere, ocean and land.” – Policy-makers’ Headline Statements, first line. 

“Human influence on the climate system is now an established fact:…It is unequivocal that the increase of CO2, methane (CH4) and nitrous oxide (N2O) in the atmosphere over the industrial era is the result of human activities and that human influence is the principal driver of many changes observed across the atmosphere, ocean, cryosphere and biosphere.” Pg. TS-8

“Table TS.1:  Synthesis:  Warming of the global climate system since preindustrial times], Observed Change Assessment – Established Fact; Human Contribution Assessment – Established Fact.”  Pg. TS-33.

‘Less than 1% probability’ that Earth’s energy imbalance increase occurred naturally, say Princeton and GFDL scientists, Liz Fuller-Wright, 2021. https://www.princeton.edu/news/2021/07/28/less-1-probability-earths-energy-imbalance-increase-occurred-naturally-say

“[Shiv Priyam Raghuraman] and his co-authors used satellite observations from 2001 to 2020 and found that Earth’s “energy imbalance” is growing….’It is exceptionally unlikely — less than 1% probability — that this trend can be explained by natural variations in the climate system,’ said Raghuraman.”

Anthropogenic forcing and response yield observed positive trend in Earth’s energy imbalance, Reghuraman et al, 2021.   https://www.nature.com/articles/s41467-021-24544-4

Saturday, April 21, 2018

Global Heat Budget #2: Oceans


The world’s oceans are warming.  Ocean warming is the strongest confirmation that greenhouse gases are warming the planet. 

The heat capacity of water is among the highest of common substances.  That means that water can absorb a large amount of heat while its temperature changes only slightly.  The measurable warming of the world’s oceans indicates that a very large amount of heat has come from somewhere.  The only credible source for so much heat is the retention of heat by atmospheric greenhouse gases.  Let’s look at the source of the data, and the numbers.

ARGO Oceanographic Program
Rising ocean temperatures have been measured by oceanographic surveys since the 1970s.  However, these ocean surveys were limited in geographic coverage and continuity of data acquisition.  A more comprehensive system, ARGO, was put in place beginning in the early 2000s, with improvements and new deployments continuing today.  Today, ARGO consists of nearly 4000 floats which continuously measure ocean temperature, salinity, density and currents from the surface to 2000 meters. 
ARGO floats measure temperature to an accuracy of two-thousands (0.002) of a degree Celsius.  The floats are “parked” at 1000 meters, and every ten days submerge to 2000 meters and return to the surface, where data is broadcast to satellite receivers.  The system provides comprehensive coverage worldwide except for polar latitudes, and continuous measurements.

Ocean *Weather*
Like the atmosphere, ocean temperatures are seasonal, cyclic, variable, and turbulent.  The large number of ARGO floats was designed to adequately measure and characterize the variable temperatures of the ocean.  The volume of data acquired allow scientists to make maps of the changing water temperature and calculate the total heat content in the ocean.
Observations
Surface temperatures are warming the fastest.  NOAA presents charts of average ocean temperature and ocean heat content according to water depth, based on ARGO observations and earlier oceanographic studies.

Surface waters (0 – 100 m) have warmed by about 0.6 degrees C on average since the late 1960s. 
Intermediate waters (0 – 700 m) have warmed by a little over 0.2 degrees C on average since the late 1960s. 
Relatively deep waters (0 – 2000 m) have warmed by about 0.1 degree C on average, since the late 1960s.
Over all depth increments observed, the rate of warming seems to be slightly increasing.

Heat Content
The changing heat content of the ocean is a simple function of the change in temperature.  The heat capacity (or specific heat) of water represents the amount of heat required to change the temperature of a given volume of water.  From an observed change in temperature, we can back-calculate the amount of heat that has entered the ocean.  The density and heat capacity of water change slightly with pressure (and water depth).  NOAA has calculated the heat content of the ocean over various depth intervals from the temperature data and heat capacity.  

The heat content of the ocean at intermediate depths (0 – 700 m) has increased by about 2 x 10²³ joules since the late 1960s. 
The heat content from the surface to 2000 meters (0 – 2000 m) has increased by about 3 x 10²³ joules since the late 1960s.  This means that the heat content over the interval from 700 m to 2000 m has increased by about 1 x 10²³ joules, about half of the increase in heat content at intermediate water depths.
Source of Increasing Heat
NOAA unfortunately did not report temperature change or heat content in separate depth intervals, but only in overlapping intervals of 0 – 100 , 0 – 700, and 0 – 2000 meters.  Starting from the average change of temperature for each interval, I calculated the heat content for 0 – 100 m, 100 – 700 m, and 700 – 2000 m.  My figure for total heat content calculated from temperature change exceeds the heat content reported by NOAA by 14%, probably due to errors in my single-point values for temperature or heat capacity over these depth intervals.
Temp Rise (C)
Volume (km3)
Density (g/cc)
Mass (kg)


Heat Capacity (J/kg-C)
Change in Heat Content (J)
0 - 100 m
0.6
5.23E+07
1.025
5.10E+19


3928.00
1.20E+23
0 - 700 m
0.2
3.69E+08
1.034
3.57E+20


3421.50
2.44E+23
0 - 2000 m
0.1
1.36E+09
1.329
1.02E+21


3339.04
3.41E+23
Intervals
Change in Heat Content
Percent of Heat Change
Change in Heat Content per 100 m
0 - 100 m
1.2E+23
35%
1.2E+23
100 m - 700 m
1.2E+23
36%
2.1E+22
700 m - 2000 m
9.6E+22
28%
7.4E+21

There is a large difference between the heat gained in the upper 100 meters of the ocean and the heat gained at deeper levels by equivalent volume.  The ocean is clearly heating from the surface downward.  About 35% of the total heat increase has occurred in the upper 100 meters of the ocean, about 36% in the next 600 meters, and about 28% in the next 1300 meters.  Research on deep ocean currents shows that heat is also being introduced into the deep ocean by currents, rather than by conduction. 

The geographic distribution of ocean heating also shows atmospheric influence.  The ARGO ocean data shows distinct heating anomalies between 30 and 40 degrees of latitude, north and south.  These are the down-welling points of large atmospheric convection cells termed Hadley cells.  You can see atmospheric circulation in observations of ocean warming.


Conclusion
The first post in this series quantified anthropogenic heating and cooling, primarily from greenhouse gases, particularly CO2.  This post looked at the largest heat sink on earth – the oceans.  

Net Anthropogenic heat absorbed by the planet from 1970 to 2016 was about 3.4 x 10²³ joules.  Over the same period, the heat content of the oceans has increased by about 3.0 x 10²³ joules.  Anthropogenic heat is the only credible source for the heat appearing in the ocean, and the warming oceans confirm that greenhouse gases are, in fact, warming the planet.  
 -------------------
References
Global Heat Budget #1: Anthropogenic Heat


Ocean heat content figures.

Ocean temperature figures.

Gridded temperature data in map view.

The Oceans Their Physics, Chemistry, and General Biology, UC Press E-Books Collection, 1982-2004, University of California Press 
Physical properties of sea water.

Wednesday, April 11, 2018

Global Heat Budget #1: Anthropogenic Heat

I have been away from my blogs for far too long.  I will try to post a series on the global heat budget.

Previously, I posted a lot of work on atmospheric CO2, considering the geographic distribution, isotope data, rates of change, comparison to man-made emissions from various sources, and interaction of the atmosphere with global carbon reservoirs.  The latest summary post is here:
I deliberately avoided the question of climate change to focus on the science of atmospheric CO2.

For the past year, I’ve been studying on the problem of global warming (the first-order consequence of greenhouse gases) and climate change (the higher-order consequences of greenhouse gases).  And I’ve been posting less while I worked to understand the data.

I’m going to present what I’ve learned as a series of short posts, rather than writing a book.
The very short version is this:

The Global Heat Budget; The Very Short Version
People have raised the concentration of atmospheric CO2 by burning fossil fuels.  The volume of CO2 released by fossil fuels has increased sharply since about 1950, and continues to increase today.

CO2 and other greenhouse gases retain heat in the atmosphere.  The quantity of heat is easily calculated as a function of the concentration of CO2 in the air.  We can calculate the amount of heat that has been trapped to date, and we can forecast the heat that will be trapped in the future.

Heat is increasing in heat sinks on earth.  Observations show that the amount of heat appearing in earth’s heat sinks is approximately equal to the heat retained by greenhouse gases.  The heat is showing up as rising ocean temperatures, melting ice, and a warmer atmosphere.  The quantity of heat appearing in these systems has been measured by high-accuracy monitoring programs since about 2003.  The warming ocean accounts for about 95 percent of our estimates of anthropogenic heat.  Retained heat due to greenhouse gases is the only credible source for the heat appearing in heat sinks.

Sea-level is rising.  Sea level rise has been documented by tidal gauges for 130 years, and by high-accuracy satellite measurements since 1992.  The amount of sea level rise matches the observed volumes of melted ice, thermal expansion of the ocean, and ground-water extraction.  The fact of rising sea level confirms observations of melting ice and warming oceans.

Higher atmospheric CO2 concentrations are inevitable for the foreseeable future.  Quantitative forecasts of future heating indicate serious and expensive problems will develop for the nation & the world.
Atmospheric CO2 has risen as a consequence of fossil fuel emissions.  The following chart is my version of the Keeling Curve (http://dougrobbins.blogspot.com/2016/08/the-keeling-curve-and-global-co2.html) showing global CO2 concentration, including high-amplitude seasonal cycles in the Northern Hemisphere, and low-amplitude seasonal cycles in the Southern Hemisphere.
History of Study of CO2 as a Greenhouse Gas
The physics of CO2 as a greenhouse gas is settled science, based on published studies dating back over 150 years.  High accuracy programs to measure melting ice, ocean temperatures, and rising sea level have been in place in recent decades, long enough to yield conclusive results.

Carbon dioxide was first proved to be a greenhouse gas by John Tyndall in 1859, proving speculation that began in 1820.  The planet-wide effect of changing CO2 concentrations was calculated by the Swedish chemist Arrhenius and published in 1896.  Arrhenius was originally attempting to find the cause of the ice ages, but later recognized the possibility that fossil fuel emissions could change the climate, and published that result in 1906.  Quantitative measurements of CO2 and rising temperatures were published in 1938 by Guy Callendar.  Systematic global measurements of CO2 concentrations began in 1955 by Charles Keeling.  Satellite measurements of sea level rise began in 1992.  Satellite measurements of Antarctic and Greenland ice mass began in 2003.  Detailed, comprehensive and continuous measurements of ocean temperatures began in 2004.

Calculation of Heat Retained by Greenhouse Gases
Greenhouse gases are mostly transparent to wavelengths of visible light, which carry most of the energy from our sun.  Visible light strikes the earth and is converted to heat.  Normally, some portion of that energy is re-radiated into space as thermal infrared radiation.  But greenhouse gases are opaque to infrared wavelengths, and trap heat in the atmosphere as a function of the concentration of those gases.  As greenhouse gases have accumulated in the atmosphere, lower levels of the atmosphere have warmed.  Higher levels of the atmosphere have cooled, as more heat has been trapped near the surface.

NOAA publishes historical tables of the atmospheric heating coefficients (known by the awkward and uninformative phrase *radiative forcing*) for anthropogenic greenhouse gases, dating back to 1979.  The coefficients are prepared according to international standards, taking into account cloudiness and angle of solar incidence to yield a global average.  You can do the math yourself to calculate annual heat retained by each greenhouse gas, which I have done.  Carbon dioxide represents about two-thirds of the heat retained in the atmosphere by greenhouse gases.  Methane, nitrogen oxide, chlorofluorocarbons (CFCs) and minor greenhouse gases account for the rest of the heat retained by greenhouse gases. 
In 1979, greenhouse gases retained about 7 x 10²¹ joules.  By 2016, greenhouse gases retained about 1.2 x 10²² joules, an increase of 78% in annual heating.  It’s difficult to conceptualize how much heat is represented by 1022 joules.  A joule is about ¼ of a standard calorie – the heat required to raise a gram of water by one degree C.  It’s a small amount of heat.  But 12,000,000,000,000,000,000,000 joules is a lot of heat.  Later in this series, we’ll consider how the earth can absorb that quantity of heat, and where the heat is going.
Aerosols and Anthropogenic Cooling
Aerosols are the least-well quantified anthropogenic influence on earth’s climate.  Sulfate aerosols cool the atmosphere by making clouds more abundant and reflective.  Sulfates can originate from volcanic eruptions, but are also a common industrial pollutant.  Carbon black aerosols warm the atmosphere by absorbing sunlight. 

Sulfate emissions have dropped dramatically in the United States and Europe over the past 25 years, thanks to regulations intended to limit acid rain, but world-wide sulfate emissions have continued to grow.  The average global impact of sulfates and black carbon aerosols is shown in the following graphs, but the more significant impacts are regional.  South Asia suffers from the greatest carbon black emissions and impact, while China is now the source of most sulfate emissions.

IPCC Net Anthropogenic Heating and Cooling
The IPCC (International Panel on Climate Change) 5th Climate Assessment contains a table of anthropogenic heating and cooling coefficients.  The IPCC numbers for conventional greenhouse gases are identical to NOAA, but IPCC also recognizes other anthropogenic factors, which can both heat and cool the atmosphere.  These factors act by direct absorption of sunlight, or by a greenhouse effect that is restricted to certain levels in the atmosphere.  The IPCC recognizes the warming factors of tropospheric ozone (O3), stratospheric water vapor (H2O), black carbon on snow, and contrails.   IPCC recognizes cooling factors, including land-use changes (which affect the reflectivity of the earth), stratospheric ozone, and aerosols. 

Here is a chart based on IPCC data, showing anthropogenic heating and cooling coefficients (*radiative forcing*).

Primary Anthropogenic and Other Heat
Strangely, to me, the IPCC report makes no mention of another source of anthropogenic heat – the primary heat resulting from burning fossil fuels and nuclear plants, and secondarily, the primary heat resulting from deforestation.  The global heat from non-renewable sources is reported in the BP Statistical Review of World Energy.  The energy released by deforestation can be easily calculated from the volumes of carbon dioxide released, which is estimated in several sources.  These sources of heat represent about 5% and 1%, respectively, of the net anthropogenic heat reported by IPCC, and exceed several other minor sources of heat in the report.

Here is a chart showing the calculated anthropogenic heating and cooling, based on IPCC estimates for radiative forcing, plus heat from primary energy.
I considered and calculated the incremental accumulation of geothermal heat, due to the retention of heat by greenhouse gases.  Geothermal heat is normally in a steady state, with heat flux from the planet balanced by thermal radiation into space.  The quantity of heat retained is quite small, however, and not worth adding to the heat budget. 

Agriculture has a significant influence on the planet’s seasonal CO2 cycles, due to the preponderance of agriculture in the temperate Northern Hemisphere.  Changes in atmospheric CO2 necessarily imply changes in heat, through the reduction and oxidation of carbon.  Agriculture appears to be a zero-sum influence on the long-term heat budget but may be significant in seasonal climate modeling. 

Net Anthropogenic Heat
The net heating coefficient (*radiative forcing*) for all anthropogenic heating and cooling was about 2.4 watts/min 2011.  The global average for solar insolation at the top of the atmosphere is 1361 watts/m2.  About 1000 watts/mof the sun's radiation reaches the earth's surface.  Anthropogenic heat represents a small but noticeable increment to the natural heating of the earth by the sun, about 0.24% above the natural, steady state of solar heating and radiative cooling.

Using the IPCC heating and cooling numbers, plus primary heat, we see that net global anthropogenic heating was 9.8 x 10²¹  joules in 2011. That’s enough heat to melt about 29,500 gigatonnes of ice, or to bring 14,000 gigatonnes of water from room temperature to boiling.  Of course, the icecaps are much larger than 29,500 gigatonnes of ice, and the ocean is much larger than 14,000 gigatonnes of water.  So the changes we see in a single year are subtle.
Net anthropogenic heat from 1970 to 2016 is about 3.4 x 10²³ joules.  The effect of heat retained by greenhouse gases is cumulative. Over time, the consequences are not so subtle.  In the next few posts, we will look at how anthropogenic heat is being distributed in earth’s heat sinks.  
-------------------------------------------
References
NOAA Radiative Forcing Tables

IPCC climate change references
31 page Summary

VOX article on BECCS (Bio-energy and Carbon Capture and Sequestration) requirement to keep temperatures less than 2 degrees higher than pre-industrial levels.

2013 Full IPCC report, 1500+ pages

Fourth National Climate Assessment


BP Statistical Review of World Energy
Primary Heat from Fossil Fuels and Nuclear Energy

Primary Heat from Deforestation
Primary heat calculated from CO2 released.
Houghton, R.A. 2008. Carbon Flux to the Atmosphere from Land-Use Changes: 1850-2005. In TRENDS: A Compendium of Data on Global Change. Carbon Dioxide Information Analysis Center, Oak Ridge National Laboratory, U.S. Department of Energy, Oak Ridge, Tenn., U.S.A.


Aerosols
IPCC 5th Climate Assessment, pg. 1446.

Aerosols caused by human activity play a profound and complex role in the climate system through radiative effects in the atmosphere and on snow and ice surfaces and through effects on cloud formation and properties. The combined forcing of aerosol–radiation and aerosol–cloud interactions is negative (cooling) over the industrial era, offsetting a substantial part of greenhouse gas forcing, which is currently the predominant human contribution. The magnitude of this offset, globally averaged, has declined in recent decades, despite increasing trends in aerosol emissions or abundances in some regions. (emphasis mine).

By nucleating a larger number of smaller cloud drops, aerosols affect cloud radiative forcing in various ways. (A) Buffering in nonprecipitating clouds. The smaller drops evaporate faster and cause more mixing of ambient air into the cloud top, which further enhances evaporation. (B) Strong cooling. Pristine cloud cover breaks up by losing water to rain that further cleanses the air in a positive feedback loop. Aerosols suppressing precipitation prevent the breakup. (C) Larger and longer-lasting cirrus clouds. By delaying precipitation, aerosols can invigorate deep convective clouds and cause colder cloud tops that emit less thermal radiation. The smaller ice particles induced by the pollution aerosols precipitate more slowly from the anvils. This can cause larger and longer-lasting cirrus clouds, with opposite effects in the thermal and solar radiation. The net effect depends on the relative magnitudes.