Rome Didn't Fall in A Day.


Objective Truth Exists, and is Accessible to Everyone.

All Human Problems can be Solved with Enough Knowledge, Wealth, Social Cooperation and Time.


Photo: Rusty Peak, Anchorage, Alaska


Translate

Tuesday, February 28, 2012

Oil Imports, Trade Deficits, and the US International Investment Position -- II

The consequence of importing oil at a rate of a billion dollars a day is that the net foreign investment position of the United States is steadily eroding.

REVISED February, 2012. My original article was posted January 2011.
This revision adds improved charts and data.

The US annual trade deficit has been growing since 1980, reaching about $750 billion a year in 2006.   The annual trade deficit diminished sharply in the 2009 recession to about $380 billion a year.  It's interesting to note that at a billion dollars a day, oil imports accounted essentially for the entire trade deficit during the recession.  


Let’s begin with a look at the volumes and costs of oil imports.   The United States began importing significant volumes of oil in the 1950s, and sharply increased imports about 1973.   Volumes of imported oil are sensitive to price.   The volume of imported oil declined due to high prices in the early 1980s, and volumes increase again following the price decline in 1986. 


The volume of imported oil exceeded the volume of domestic production in 1989.  Imports peaked in 2006 at 14 million  barrels per day (MMBPD).  Imports have since declined to 11 MMBPD due to recession, increased price, and a 0.5 MMBPD increase in domestic production. 

Prices have increased dramatically in recent years, rising from an average price of about $20/barrel through the 1990s, to a current price of $125 per barrel (Brent).  Future prices are likely to be volatile, given political instability in the Middle East, and the reasonable prospect of peak oil, offset by potential new technologies and the large potential for efficiency and conservation in oil-intensive economies (see Winning the Oil Endgame, Amory Lovins). 

Given the recent increase in the price of oil, the cost of imports to the US economy has increased from roughly 10 $ billion per month (2000 – 2004) to over 40 $ billion per month today, at yesterday’s Brent price of $127 per barrel. 

The U.S. Net International Investment Position represents the cumulative influence of the balance of trade, receipts and payments of income, investment performance and transfer payments and transactions.  The net investment position of the United States turned negative in 1986, and it currently about 2.5 $ trillion, or about 20% of annual GDP.  

By comparison, the cumulative cost of imported oil since 1981 probably passed 4 $trillion dollars last year.  The cost of imported oil in recent years is an ever-increasing negative slope, paralleling the negative trend of our international investment position. 

Alternatively, we could focus on the cost of importing consumer electronics, textiles, cars, metals or other imports.  But the cost of imported oil is clearly one of persistent reasons for the loss of American wealth and damage to the American economy.


Sunday, February 12, 2012

Peak Oil V -- Discovered, Undeveloped Reserves in the Middle East


So far, in the Peak Oil Series, we first looked at peak oil theory, and some principles of oil reserves.   We also considered sources of new reserves-- forecasts for new discoveries, lag in recognizing reserves in new fields, and growth in recovery efficiency.   This post is about another source of new oil-- discovered, undeveloped reserves in the Middle East.  

Let’s take a look at two charts, that taken together have significant implications for peak oil. 
 The first chart is by Fredrik Robelius, from his PhD thesis at the University of Uppsala, 2007.  The chart shows the rate of production in the Middle East, from giant fields and from smaller fields


The second chart is the “creaming curve” for the Middle East, by Jean Laherrere, 2010.    Cumulative reserves discovered is on the vertical axis, and fields are on the horizontal axis in the order of discovery.  Note that the curve initially rises sharply and then flattens; the largest fields are found first, and progressively smaller fields are discovered with increasing exploration maturity.

Let’s see why these charts are significant.

Robelius presents an analysis of giant fields as an approach to peak oil.  Giant fields are defined as fields with greater than 500 million barrels of ultimate recoverable reserves.  Historically, giant fields have dominated production. 


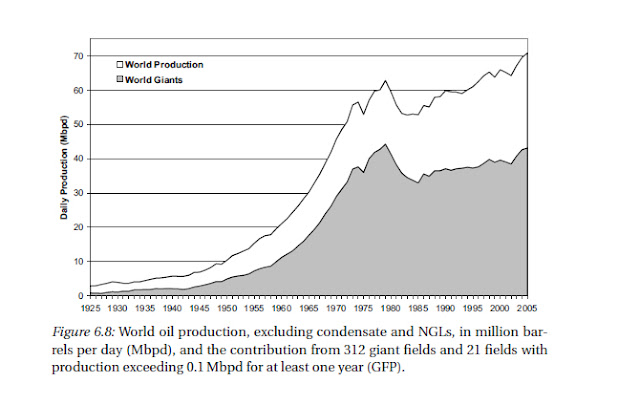
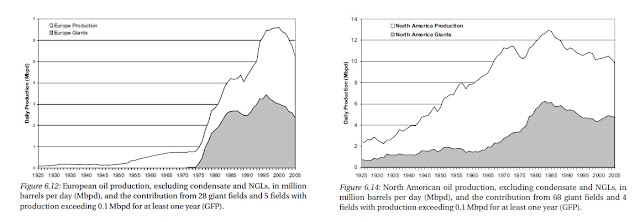
Production plots for Europe and North America show mature production in clear decline.  Production from fields smaller than giant fields represent about half of peak and post-peak production.

Production plots for Africa and Asia are show currently increasing production.  Production in Africa is increasing, due to contributions from deepwater offshore fields, while Asian production is increasing on increasing contributions from smaller fields. 

Charts for Eurasia (Former Soviet Union) and South America show peaks, decline, and resurgent production.  In both cases, the early peak and decline represent easily-accessed oil, and the later peak represents more remote and difficult production.  Political events contributed to the decline in both cases.   The contribution of smaller fields remains significant, again representing about half of current production.


Robelius’ plot for the Middle East shows a dramatically different picture.    First, note that the scale of the chart is considerably larger than any of the other continental charts, with current production exceeding 20 million bpd.  Second, note that about 90% of production is coming from 79 giant fields.    Production from giant fields is still increasing, and smaller fields have made relatively little contribution to date.

Recall that oilfields have a fractal-like size distribution.  Large fields imply the existence of smaller fields.  From this chart, and comparison to the charts of mature petroleum provinces, we can conclude that substantial additional production can be expected from fields smaller than 500 million barrels in the Middle East.  If smaller fields match the contribution of giant fields, as has happened in every other petroleum province, we can expect an additional 20 million barrels per day of production from smaller fields in the Middle East.

From Robelius’ charts alone, it might be suggested that the super-giant fields (> 10 billion barrels) of the Middle-East dwarf the contribution of small fields, and that small fields in the Middle-East will not reach the percentage contribution seen in other parts of the world.  That is probably partly true.  But we have another piece of data in the creaming curve presented by Jean Laherrere.

In Laherrere’s chart, we see that 1400 fields have been discovered in the Middle East.  The upper bright green curve represents official reserve estimates, totaling 1000 billion barrels.   Laherrere has discounted the official reserves by 30% to create the dark green curve, totaling 700 billion barrels.    (Laherrere cites sources describing 300 billion barrels of the official figure as speculative reserves.)    
Consider the lower curve, and estimate the reserves attributable to 79 fields.  (Remember that the fields are not in rank order, but in order of discovery.)  The sum of the steepest parts of the curve, for 79 fields, would seem to be about 400 billion barrels.   This still leaves about 300 billion barrels of discovered reserves in over 1300 oilfields which have barely been tapped. 

Development of smaller fields in the Middle East will require substantial capital, and political stability.   But when the giant fields of the Middle East begin their inexorable decline, there is a substantial resource available in smaller fields which can be brought on production.   Depending on the timing of development, these fields may raise the volume of global peak production, to the range of 90 – 100 million barrels per day, or delay the peak by some years.
-------------------------

Jean Laherrere is co-author of “The End of Cheap Oil”, Scientific American, 1998.   
Other publications can be found on the APSO (Association for the Study of Peak Oil) France website.


Fredrik Robelius, Giant Oil Fields – The Highway to Oil
http://uu.diva-portal.org/smash/record.jsf?pid=diva2:169774


Monday, February 6, 2012

Peak Oil IV: Recognition Lag and Reserve Growth

According to Hubbert’s theory, Peak Oil should occur when half of the global oil endowment has been produced.   We explored this idea in the first post of the Peak Oil series.  Cumulative production to date through 2011 has been about 1365 billion barrels.    Production has not yet peaked, which implies a global endowment of over 2730 billion barrels.   This number is reasonable, considering the USGS mean estimate of 3000 billion barrels, and high estimate of 3900 billion barrels for the recoverable global oil endowment.

We know very well that oil discoveries peaked in the 1960’s.  Why then, is it so difficult to quantify the global endowment of oil?  Let’s look at the work of two researchers, Fredrik Robelius and Richard Nehring.

Recognition Lag
Fredrik Robelius wrote a very important contribution to the theory of Peak Oil as a PhD thesis at Uppsala University in 2007.  I will use only a single figure from that thesis at this time, but I hope to write more about it in a later post. 

Robelius’ figure shows volumes of global oil discoveries, by the year of discovery.  Reserve estimates are back-dated to the year of discovery, and clearly shows the peak of oil discoveries around 1960, and the cross-over, when global production exceeded volumes of new discoveries about 1985.   Robelius’ figure shows another interesting dimension which is seldom presented:  the volumes of reserve growth in old fields.   Estimates made about a decade apart, in 1994 and 2005, show large positive revisions to previous estimates; “new” reserves in old fields. 

Reserve growth is well-known and expected.  There are various reasons for reserve growth: revisions to estimates of oil in-place, production performance data, additional drilling, step-outs and field extensions, secondary and tertiary recovery technologies and investments, and the innate pessimism of reserve estimates by Production Department engineers(as opposed to the innate optimism of reserve estimates by Exploration Department geologists).   In particular, proved reserves estimates are expected to be of reasonable certainty, according to both law and professional practice.   According to guidance provided by staff of the United States Securities and Exchange Commission, upward reserve revisions should be much more likely than downward revisions.

In the 1980’s, Richard Nehring realized that a number of years may pass before a field is fully evaluated, and that the reserves are estimated correctly.  In the paper “What Really Happened in 1986”, Nehring   coined the term “recognition lag” to describe the phenomenon.   Most reserve growth happens in the first few years of field delineation, but we see in Robelius’ chart that fields discovered in 1960 had about 100% reserve growth, doubling the total oil endowment, 35 years after discovery!   Some researchers have attempted to derive a formula to estimate the volume of reserve growth in later years.  However, I believe that reserve growth is too random to develop meaningful predictions from early trends.   

Reserve Growth
Nehring has recently concentrated on the idea of reserve growth through improvements in recovery efficiency (“Recovery Growth”), which is the recoverable fraction of oil in the ground.    I greatly respect Nehring's work and insight, but believe the estimates he presents are too high.  Furthermore, he should not simply add the low and high estimates in each category to obtain the low-to-high range.  These should be combined using a probabilistic approach.

Nehring presents a range of the world oil endowment with a low, middle and high estimates of 3270 – 4290 – 5620 billion barrels.  By comparison, the USGS range of estimates is 2250 – 3000 – 3900.  Nehring’s higher estimates depend largely on his assumptions about recovery growth.  His low, medium and high ranges (715 – 1095 – 1585 Bbbls) represent assumed global average recovery factors of 35% - 40% - 45% of original oil in place.  Nehring says that this will take 50 to 80 years to realize. 

Based on experience and technical reading, I find Nehring’s recovery range too high.   Global giant oilfields are currently at about 22% recovery, and are expected to reach ultimate recoveries of 30% to 35%.    There is a fair amount of complexity to the issue.  Fields in carbonate reservoirs represent about 60% of remaining oil.  Recoveries in carbonate fields are highly variable, like the reservoirs, and I find contradictory numbers for expected average recovery, with the low side between 20 – 25%, and the high side at 36% (SPE paper 84459).

There are physical, technical, and economic limits to increasing oil recovery.  Oil can be withdrawn from a reservoir, but the saturation of oil approaches a limit called the irreducible saturation, at which oil will no longer move through the pore system.  Reservoir heterogeneity also limits the physical recovery possible from a reservoir.  Low porosity,smaller reservoirs offshore or remote locations, and great drilling depth all tend to reduce the technical and economic recovery of oil.   However, these are characteristic of many of the remaining developing oil fields.  Examples include Tengiz and Kashagan in Kazakhstan, fields of the Russian arctic, undeveloped fields of the Middle East.   I expect relatively lower fractional recovery from these fields than earlier discoveries.  The law of diminishing returns is alive and well, and I expect global average recovery to be about 35%.   This would support the low end of the range proposed by Nehring on recovery growth, of about 700 billion barrels.

As an aside, the low-medium-high ranges proposed by Nehring for independent variables should not be added as simple sums.  These uncertainty ranges should be added stochastically, which will result in a narrower distribution.

Fredrik Robelius, Giant Oil Fields – The Highway to Oil
http://uu.diva-portal.org/smash/record.jsf?pid=diva2:169774

Richard G. Nehring,  Peak Oil: Why, When, and How


Other references
EOR projects are not suited to offshore, deep, small, heavy or unconventional reservoirs.

Global recovery factors are expected to ultimately be 30 – 35%.

Recovery factors in high-quality uniform sandstone reservoirs after secondary recovery  may be 40 to 60%; but the norm is considerably lower.  In chalk limestone fields is generally in the low 20’s. 

60% of remaining oil is in carbonate fields.
The overwhelming majority of proven oil in the Middle East is in carbonate reservoirs
Recovery in fractured carbonate reservoirs is 20% - 25%.  


Overall, the carbonate oil reservoirs have an average ultimate recovery factor of 36%.

SPE 84459

Often noted that most reserve growth occurs in first 6 years after discovery.