In my first two posts, I compared Per Capita GDP to oil consumption, and then to the Corruption Index published by Transparency International. In this post, I will improve and combine those themes.
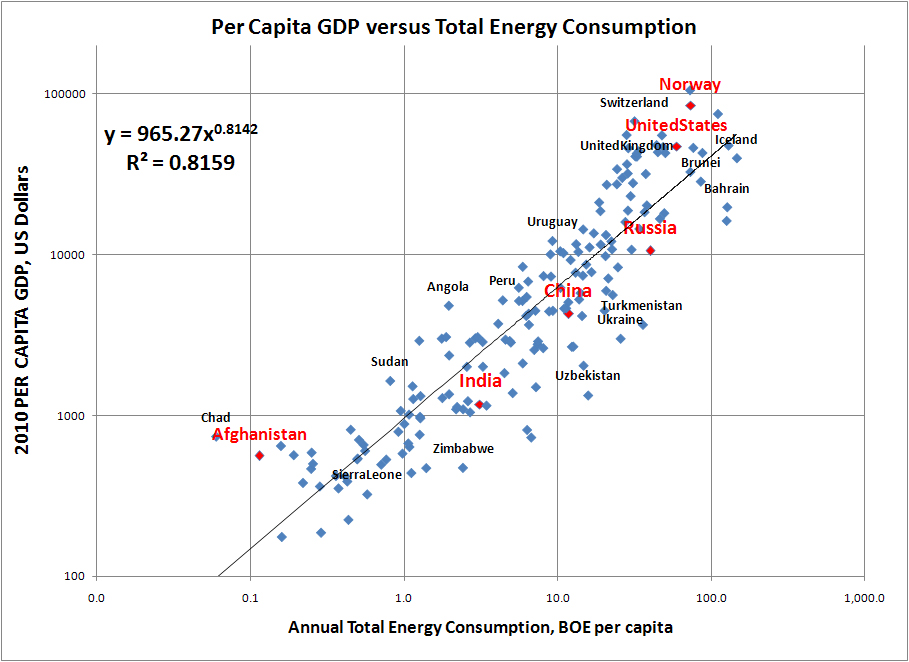
Productivity requires energy. Every productive activity requires energy: to extract resources; to change those resources into products; to transport workers to the place of work; to transport products to market; to move water for crops; etc. So it is not too surprising that nations with higher energy consumption have higher GDP per capita. Here is a chart showing GDP per capita vs. total energy consumption per capita. In my earlier post, I used only oil consumption per capita, but analytically, total energy consumption is clearly a better choice.

Another interesting correlation is to plot GDP per capita vs. the Corruption Index of Tranparency International. Here's the chart:

There is greater scatter in the Corruption chart than the Energy chart, and the R-squared correlation value is lower. Still, the relationship is clear and undeniable.
The converse of Corruption is Integrity. To keep the parallelism with Energy, which has a positive relationship with GDP, I will use the word Integrity to define the second parameter.
As an aside, I should mention that correlation does not prove causation. That is, we are likely to conclude that nations with high integrity have high GDP because their businesses and government use energy more efficiently. Direct costs of the Enron fraud approached $50 billion; indirect costs are clearly substantial. (http://en.wikipedia.org/wiki/Enron_scandal) Losses from the housing/banking crisis of 2008 are orders of magnitude higher. The crisis had its roots in corruption at multiple levels: brokers and appraisers fraudulently elevating home prices; lenders using gimmicks and fraud to write loans to people who could not afford them; banks aggregating toxic loans for sale to third parties; rating agencies issuing "A" credit ratings to toxic debt, because of financial interests in the issuing organizations. Banking losses topped $2.8 trillion (and continue to grow); retirement assets lost $10 trillion. Total US household wealth fell by $14 -trillion. These market-value values might overstate the losses, but US real GDP declined by over $500 billion annual through 2008 and 2009. Economies also suffered globally, by perhaps 4%, or about $2 trillion of lost productivity. (http://en.wikipedia.org/wiki/Late-2000s_recession, http://en.wikipedia.org/wiki/Global_GDP).
Alternatively, we might also conclude that integrity is a luxury that only people living in a wealthy society can afford. I believe that both of these relationships are partly true.
What happens if we combine these factors? I used the trend-line regression feature available in Excel charts, and created an equation combining the influence of Energy and Integrity on Per Capita GDP. With trial and error, I found the best result by weighting Energy by two-thirds, and Integrity by one-third. Here's the equation:

Productivity requires energy. Every productive activity requires energy: to extract resources; to change those resources into products; to transport workers to the place of work; to transport products to market; to move water for crops; etc. So it is not too surprising that nations with higher energy consumption have higher GDP per capita. Here is a chart showing GDP per capita vs. total energy consumption per capita. In my earlier post, I used only oil consumption per capita, but analytically, total energy consumption is clearly a better choice.
Another interesting correlation is to plot GDP per capita vs. the Corruption Index of Tranparency International. Here's the chart:

There is greater scatter in the Corruption chart than the Energy chart, and the R-squared correlation value is lower. Still, the relationship is clear and undeniable.
The converse of Corruption is Integrity. To keep the parallelism with Energy, which has a positive relationship with GDP, I will use the word Integrity to define the second parameter.
As an aside, I should mention that correlation does not prove causation. That is, we are likely to conclude that nations with high integrity have high GDP because their businesses and government use energy more efficiently. Direct costs of the Enron fraud approached $50 billion; indirect costs are clearly substantial. (http://en.wikipedia.org/wiki/Enron_scandal) Losses from the housing/banking crisis of 2008 are orders of magnitude higher. The crisis had its roots in corruption at multiple levels: brokers and appraisers fraudulently elevating home prices; lenders using gimmicks and fraud to write loans to people who could not afford them; banks aggregating toxic loans for sale to third parties; rating agencies issuing "A" credit ratings to toxic debt, because of financial interests in the issuing organizations. Banking losses topped $2.8 trillion (and continue to grow); retirement assets lost $10 trillion. Total US household wealth fell by $14 -trillion. These market-value values might overstate the losses, but US real GDP declined by over $500 billion annual through 2008 and 2009. Economies also suffered globally, by perhaps 4%, or about $2 trillion of lost productivity. (http://en.wikipedia.org/wiki/Late-2000s_recession, http://en.wikipedia.org/wiki/Global_GDP).
Alternatively, we might also conclude that integrity is a luxury that only people living in a wealthy society can afford. I believe that both of these relationships are partly true.
What happens if we combine these factors? I used the trend-line regression feature available in Excel charts, and created an equation combining the influence of Energy and Integrity on Per Capita GDP. With trial and error, I found the best result by weighting Energy by two-thirds, and Integrity by one-third. Here's the equation:
GDP = 0.67 (965*BOE 0.8142) + 0 .33(406*e0.5839*Corruption Index)/2
It looks complicated, but the odd numbers are simply correcting for different units of measure. Essentially, this equation just says that Energy consumption is twice as important as Integrity in determining a nation's GDP. The graph is easier to understand.

Simplistically, R-squared represents the fraction of observed variance that is explained by the model (note that R-squared values for different variables do not add meaningfully!). The Integrity factor alone explains about 60 percent of the variance of Per Capita GDP, while Energy alone explains about 80 percent of the variance of GDP. Combining the factors in a single model improves the fit to the data to an R-squared value of about 0.88, explaining 88% of the variance in Per Capita GDP.
The wealth of a nation depends primarily on its energy consumption, and secondarily on the intrinsic integrity of that society. Other factors, such as democracy, free enterprise, the rule of law, and private ownership of capital are either secondary factors, or correlated with energy consumption and integrity. I will now sit by the telephone waiting for the Nobel Prize in Economics.
http://www.measuringworth.com/datasets/usgdp/result.php
http://www.measuringworth.com/datasets/usgdp/result.php