Something odd is going on in the oceans.
The oceans are apparently becoming more efficient at absorbing
greenhouse gas heat from the atmosphere. Or, we are becoming better at quantifying the amount of man-made heat entering into earth systems.
According to published figures, the percentage of greenhouse
gas heat entering the ocean has risen from less than 50% in the 1970s to over 92% today. While the data from earlier
years might be suspect, recent, high-quality data confirms the earlier pattern. The apparent change suggests we need to understand the cause of the higher rate of heat transfer to the oceans. It may be that the rising rate of heat
transfer is due to higher air temperatures, or there may be another explanation
for the change. If the rising rate of
heat transfer is real, it begs the question of what was happening to the excess
heat in earlier years.
In this post, I include other sources of man-made heat to calculate a world heat budget, comparing the quantity of man-made heat with the quantity of heat observed entering the oceans, atmosphere and melting ice.
Part I. Anthropogenic Heat
Greenhouse Gases
In this post, we’ll look at the earth’s heat budget relating
to greenhouse gases and other man-made sources of heat. Greenhouse gases retain heat in the atmosphere,
because they are transparent to much of the sun’s radiation spectrum, but
opaque to most of the infrared thermal radiation. Visible radiation from the sun penetrates the
atmosphere and strikes the earth, but is trapped after being converted to infrared
thermal radiation, instead of radiating back into space. Increasing concentrations of greenhouse gases
trap increasing amounts of the sun’s heat.
We can calculate how much heat is retained, depending on the
concentration of the gas. We can look at
the history of how greenhouse gas concentrations have changed, and calculate
how much heat was retained a few years ago as compared to today. And we can forecast how much heat will be
retained in the future, and estimate what will happen because of the extra
heat.
The amount of heat trapped by greenhouse gases was measured
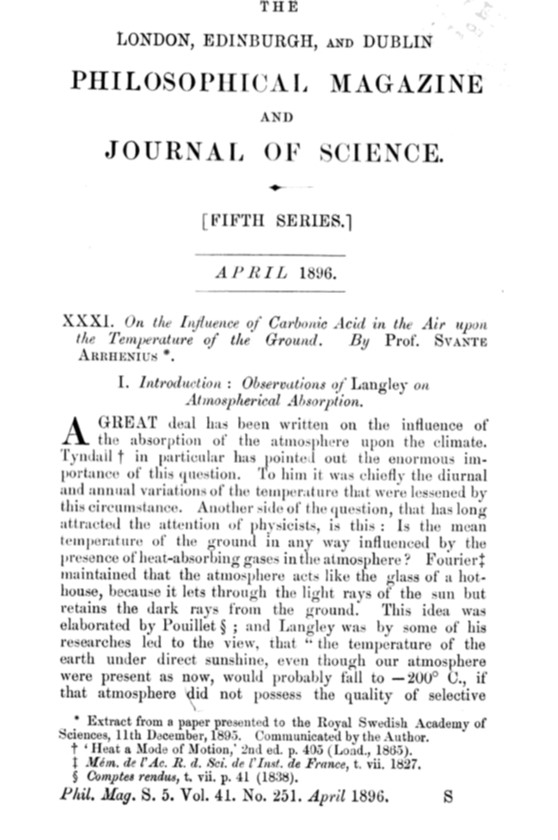
in laboratory measurements beginning in the late 1800s. The Swedish chemist Arrhenius calculated the
planetary warming that would result from doubling the amount of CO2 in the air,
and published his results in 1896. The
high-altitude chemistry of the atmosphere was measured in high-altitude flights
around the globe, improving the estimates of how much heat was trapped at
varying concentrations of greenhouse gases.
Upcoming satellite missions will define the incoming and outgoing heat
budget with even greater detail, unless cancelled by the current
administration.
The National Oceanic and Atmospheric Administration
publishes a measure of the heat retained due to greenhouse gases, termed
radiative forcing, reported in units of watts per meter squared (W/m2),
equivalent to joules per second per meter squared (J/sm2). NOAA's figures are global averages, with corrections for angle of incidence and cloudiness included. From radiative forcing, we can calculate the
global heat retained by each gas by multiplying by the cross-sectional area of
the earth, and the time interval of interest.
Here is the annual global heat retained by various greenhouse gases, as
reported by NOAA. The heat retained by
non-CO2 greenhouse gases was extrapolated for years that no data was available
(1955 – 1978), assuming a constant ratio to CO2 for the earliest data
available.
Figure 1. Annual Heat from Greenhouse Gases
The annual heat retained by greenhouse gases has increased
by 75% since 1979, driven primarily by increases in atmospheric CO2
concentrations.
The amount of heat retained by greenhouse gases is huge. The annual heat retained by greenhouse gases
in 2016 is 1.23 x 10²² joules, which is equivalent to about 533,000 Hiroshima-sized
atomic bombs, every day, or one bomb a day on a grid of about 20 miles spacing,
all over the world. Fortunately, only a
small fraction of that heat remains in the atmosphere, as we will see when we discuss
heat sinks.
Primary Heat
from Fossil Fuels, Nuclear Energy and Deforestation
For completeness and to give a sense of scale to the
greenhouse effect, we can add other man-made additions to the earth’s heat
budget. Primary heat from fossil fuels and
nuclear energy is published by the Energy Information Administration. The volumes of biomass consumed by
deforestation are uncertain, but I used published figures to estimate the
primary heat derived from deforestation, through combustion or decay, using
thermal values for combustion of wood, after corrections for moisture.
Heat from Agriculture
Heat from agriculture is another source of anthropogenic
heat, through the decay, combustion or consumption of agricultural
biomass. For the volume of agricultural
biomass, I used data from the United Nations Environment Programme for the year 2009, and scaled that number in
other years in proportion to world population.
Agricultural biomass displaces natural biomass, so I assumed an
arbitrary 50% gain in productivity in agricultural biomass, as a result of
irrigation and fertilizer. I again used
the thermal values for the combustion of wood, after corrections for moisture.
The sum of these inputs provides the history of human-caused
heat to the earth’s heat budget, from 1955 – 2016.
Figure 2. Man-made Heat from All Sources, 1955 - 2015.
Part II. Heat Sinks
To understand climate change, it is necessary to understand
what happens to the heat retained by greenhouse gases. Where is the heat going, and what is it doing
to the planet? The goal is to quantify
the heat budget for the earth, and look at how it has changed over the past
several decades.
There are three main heat sinks we can measure: the ocean,
the atmosphere, and volumes of melted ice.
I have used different methods to estimate the heat consumed by these
processes, depending upon the data available.
It is quickly apparent that the ocean is the most significant heat sink.
Ocean
Temperature
The temperature distribution of the ocean is seasonal,
heterogeneous, and changing. Maps of
ocean temperatures at various depths can be seen on NOAA’s website. Temperature data prior to 2000 was dependent
on ship tracks, and variable methods of data collection. These datasets had clusters of dense
measurements in shipping lanes, and large gaps with no data. The calculation of heat content is somewhat
uncertain. Beginning in 2000, NOAA
launched ARGO, a system of free-floating buoys measuring ocean
temperatures. Today there are 3849
active buoys, which periodically dive to depths of 2000 meters, measuring
temperatures within one-thousandth of a degree C, and returning to the surface
every ten days to broadcast measurements to satellite receivers. Here is a map of the current buoy locations.
Figure 3. Map of
Current Location of ARGO Temperature Buoys, June 27, 2017.
The temperature rise noted over the past 50 years is
relatively small, at 0.1 degrees C, but is two orders of magnitude more than
the sensitivity of the ARGO instruments.
This temperature change represents an enormous amount of heat because of
the huge volume of water and large heat capacity of the ocean. As we might expect, the temperature of the shallow ocean is rising much faster than the temperature of the deep ocean.
Figure 4. Ocean Temperature 0 -- 100 meters, NOAA
Figure 5. Ocean
Temperature 0 – 700 meters, NOAA
Figure 6. Ocean
Temperature 0 – 2000 meters, NOAA
The National Oceanographic and Atmospheric Administration
(NOAA) published a chart of ocean heat content from 1957 through 2016. NOAA did not publish the specific data used
to generate the plot, so I have made an eye-ball fit to the data using a smooth
function in Excel. The NOAA chart, and
my overlay of a smoothed function, is shown below. The smoothed function allows me to calculate
the annual change in ocean heat content. As we will see when we compare heat sources to heat sinks, the heat absorbed by the ocean is very close to the amount of heat retained in the atmosphere by greenhouse gases.
Figure 7. Cumulative
Ocean Heat Content, NOAA, 1956 - 2016.
Figure 8. Annual Change in Ocean Heat Content.
Figure 8 shows the annualized change in ocean heat content from my smoothed
version of NOAA’s heat content chart, 0 – 2000 meters. The change in heat content is constantly
positive, but the rate of change dipped in the 1960s, before a continuous
acceleration in heat content from the 1970s to the present.
Atmosphere
Similarly, the National Aeronautics and Space Administration
(NASA) published a table of average global surface air temperatures.
Figure 9. Surface air
temperature, 1880 – 2016, NOAA.
Figure 10. Surface air
temperature, 1955 – 2016, with polynomial regression to the data, NASA.
Assuming that the surface temperature change is
representative of the atmosphere as a whole (or at least, the majority of the
heat content), I calculated the annual change in atmospheric heat content. The heat content of the atmosphere is
significantly smaller than the heat content of the oceans despite a larger
change in temperature, due to the very high heat capacity of water compared to
air.
Figure 11. Annual
change in Atmospheric Heat Content.
Melting Ice
NASA has used satellites and overflights to measure the
changing volumes of ice on the Antarctic and Greenland ice sheets. The determinations have been based on a
combination of satellite gravity measurements, surface elevation measurements,
and ice-penetrating radar measurements (from overflights). Most of the high-quality surveys have
occurred since the early 2000s, in particular NASA’s GRACE (Gravity Recovery and Climate Experiment) gravity-measurement
satellite, which was launched in 2002.
Figure 12. Mass loss in Antarctica measured by NASA's GRACE satellite.
Figure 13. Mass loss in Greenland measured by NASA's GRACE satellite.
Separately, the volumes of continental glaciers and ice sheets (other than Greenland and Antarctica) have been separately studied through an inventory of photos and elevation maps, and published as a time-series of melted ice volumes. Volumes of melted ice from all three sources were reported in a single chart by Shuang Yi, et al, 2015. As I did with NOAA data for oceans and temperatures, I fitted a smooth polynomial function to the published charts, and then extracted the annual change in melted ice for all three sources. I should note that mass-loss data from NASA’s GRACE satellite shows about 10% smaller volume of ice loss than Shuang et al. Shuang et al presumably incorporated other sources of information, including ice-penetrating radar, altimetry and flow measurements from other studies.
Figure 14. Ice Loss
from Antarctica, Greenland, and other Glaciers, Shuang Yi et al, 2015, with
overlay of smoothed polynomial functions.
Image Credit: Shuang Yi et al, 2015.
Finally, I calculated a volume of ice melted in the Arctic
sea-ice, based on simple assumptions of new ice thickness (1 m) and multi-year
ice (2 m), and the changing areas reported for new and multi-year ice. The volume of melting Arctic sea-ice is
relatively trivial compared to the volumes melting from glaciers and
ice-sheets, but is still indicative of the overall melting trend in the Arctic.
Figure 15. Diminishing Arctic Sea Ice, 1953 - 2010, image credit, National Snow and Ice Center.
I assumed that the volume of ice would need to be heated by
10 degrees Celsius before melting, based on temperature profiles from drilling on
the Greenland and Antarctic ice sheets.
I then applied the heat of crystallization to the volumes of ice melted
to obtain the total heat absorbed by melting ice.
Figure 16. Heat
consumed by Global Melting Ice, 2004 – 2015.
The sum of oceanic, atmospheric, and melting ice heat sinks
is shown below. The ocean is by far the
dominant heat sink.
Figure 17. Global
Heat Absorbed by Heat Sinks.
Despite all of the news about rising atmospheric temperatures
and volumes of melted ice, the ocean is absorbing the lion’s share of heat
around the earth. By comparison to the
oceans, heat consumed by atmospheric heating and melting ice is
negligible. In 2016, the ocean absorbed
about 96% of rising heat, compared to a little over 1% for the atmosphere, and
3% for melting ice.
Part III. The Heat Budget: Retained Heat and Heat Consumed
Greenhouse Gas
Heat and Ocean Heat Content
The simplest (but incomplete) expression of the planetary
heat budget is the comparison between annual heat retained by greenhouse gases
and the rising heat content of the oceans.
Figure 18. Annual
Greenhouse Gas Heat and Annual Change in Ocean Heat Content
 The first observation to make from this chart is that heat retained in the atmosphere by greenhouse gases and heat warming the oceans are very close to the same quantities. Greenhouse gases are retaining about 1,000,000,000,000,000,000,000 joules of excess heat in the atmosphere annually, and about 1,000,000,000,000,000,000,000 joules of unexplained heat is showing up annually in the oceans. There is no known natural source of new heat warming the oceans. It cannot be a coincidence.
The second, startling
observation from this chart is that the rate of heat transfer from the
atmosphere to the oceans is changing.
The amount of heat annually absorbed by the oceans apparently fell in
the 1960s, although the data supporting this observation is weak. However, continuing forward into the era of
good data, the volume of heat absorbed by the oceans since 2000 has rapidly
increased, and the fraction of man-made heat absorbed by the oceans has also rapidly increased. As temperatures
rise, the oceans appear to be becoming more efficient at absorbing heat from
the atmosphere.
This raises a number of questions. First, is the measurement of ocean heat content correct? The quality and sensitivity of the ARGO system would suggest that the numbers are good since 2004. Second, are the calculations for man-made heat correct? These numbers contain many assumptions, and are more likely to be uncertain than the ocean heat content. Or third, was there another heat sink functioning in prior years, which is no longer working? This seems unlikely. Rather, the effort to align the sources and sinks in the earth's heat budget should focus on better quantifying of the sources of man-made heat.
Full Heat
Budget: Anthropogenic Heat and Heat Consumed in Heat Sinks
We can compare all sources of man-made heat from Part I to
all heat sinks identified in Part II, to construct a heat budget for
human-induced climate change. Let’s
look again at all sources of man-made heat, 1955 – 2015.
Figure 19. Anthropogenic
Heat, 1955 – 2015.
The red line indicates the sum of all man-made heat added to the earth’s atmosphere.
And let’s look again at the heat taken up by the oceans,
atmosphere and ice. As we noted before,
the amount of heat entering the ocean overwhelmingly dominates heat entering
the atmosphere or melting ice.
Figure 20. Heat
sinks, 1955 – 2015.
Let’s combine the two charts to see the full heat budget.
Figure 21. Man-made Heat and Heat Sinks, 1955 - 2016.
As we see, the gap between known sources of
man-made heat and the observed amount of heat entering earth systems has
narrowed, primarily due to an increasing amount of heat observed entering the
oceans. The amount of man-made heat that
we can observe entering the oceans has risen from about 40% in the 1970s to
nearly 90% today. Much of that
difference is probably due to the inadequacy of data prior to the deployment of
the ARGO system of ocean buoys in the early 2000s. However, there is a very real possibility that
it also reflects a physical change in the process of transferring heat from the
atmosphere to the ocean.
Let’s exclude questionable data, and only look at data from
2004. First, man-made heat:
Figure 22. Anthropogenic
Heat, 2004 – 2016.
And second, the heat budget including heat sinks in the oceans, atmosphere, and melting ice.
Figure 23. Global Heat Budget, 2004 - 2016.
We are still left with the striking observation that between
2004 and 2016 the fraction of man-made heat absorbed by the ocean changed from
67 percent to 87 percent. Given the high
quality of recent observations, it seems that this is a real change in the rate
of heat absorption by the ocean.
Conclusions
People are the cause
of rising temperatures and melting ice on earth. Rising temperatures are observed in the
atmosphere and oceans, and accelerating melting of ice in glaciers, arctic sea
ice, and the Greenland and Antarctic ice sheets. The heat responsible for these changes can be
quantified and compared to the heat known to be retained in the atmosphere by human
activities: CO2 and other greenhouse gases, primary heat from energy
production, primary heat from deforestation, and heat produced from
agricultural biomass. There is a close
correspondence between the quantity of man-made heat and observed heat appearing
in natural systems; 89% of the heat generated by humans can be accounted for in
known heat sinks. Further, there is no known
natural process which can be observed and measured presently warming the earth.
In more striking terms, people added 13,800,000,000,000,000,000,000
joules of heat to the atmosphere in 2016.
We observed 12,500,000,000,000,000,000,000
joules appearing in oceans, atmosphere, and melting ice with no known
alternative cause. This is not a
coincidence.
The largest source of
man-made heat is carbon dioxide from fossil fuels, which accounts for 57%
of heat input into the Earth’s heat budget.
Greenhouse gases other than CO2 account for an additional 32%, bringing
the total fraction due to greenhouse gases to 89% of man-made heat. When I began this project, I focused on only
greenhouse gases, but I found that heat appearing in heat sinks exceeded 100%
of the heat retained by greenhouse gases.
I then added other sources of man-made heat that occurred to me: primary
heat from fossil fuels and nuclear energy, primary heat from deforestation, and
primary heat from the decay of agricultural biomass. These other sources account for a smaller,
but significant 11% fraction of man-made heat.
Large quantities of
heat are retained in the atmosphere prior to absorption by other heat sinks. Heat from human sources is put into the
atmosphere before being transferred other to heat sinks. Total man-made heat delivered to the
atmosphere is equivalent to about 585,000 Hiroshima-sized bombs (533,000 from greenhouse gases alone) exploding in
the atmosphere daily, or on a world-wide grid with a spacing of about 17 miles. It seems likely that there will be
increasingly severe consequences to weather systems, as such quantities of heat
are moved from the atmosphere to their ultimate repository in heat sinks.
Oceans are absorbing
the bulk of heat produced by humans.
Oceans are absorbing 96% of the heat that can be observed going into
heat sinks on earth; with atmospheric warming and melting ice accounting for
only about 1% and 3% of the heat we can observe going into heat sinks. If the oceans were not absorbing heat from
the atmosphere, average temperatures would increase by 5 degrees C in about two
years, equivalent to the temperature change between the current climate and the
ice ages. Without oceans on earth to
absorb heat, man-made heat would quickly destroy civilization. As climate scientist John Abraham said, “Global
warming is really ocean warming.”
The fraction of
man-made heat absorbed by the oceans is increasing rapidly, according to
recent, high quality data. The fraction
of man-made heat absorbed by the ocean rose from 67% to 87% between 2004 and
2016. The cause of the changing rate of
heat absorption is not known. Some
likely possibilities include higher air temperatures and increased wave and
wind activity at the ocean’s surface.
Explanations matter. As I wrote in an earlier post, science is
about delivering explanations in terms of physical processes. Unfortunately, I could not find any physics
describing the rate of heat transfer between the atmosphere and the ocean. It is certain that higher surface air
temperatures will mean a higher rate of heat transfer to the ocean, but it
would be good to quantify that effect. Other
aspects of climate change, such has higher wind speeds and larger waves, may
also play an important role. Identifying
the processes involved and quantifying the rate of heat transfer is unfinished
work.
Future predictions of the consequences of anthropogenic heat
depend on understanding the changing rate at which the ocean is absorbing heat
from the atmosphere.
--
Appendix I.
Other Potential Sources of
Heat
When I began this study, the only source of anthropogenic
heat I considered was from greenhouse gases.
I calculated the heat retained by greenhouse gases based on NOAA’s on-line
publication of annual radiative forcing figures for each kind of greenhouse
gas. When I calculated the heat absorbed
by heat sinks for 2015, I found that new heat showing up in earth systems exceeded
the heat from greenhouse gases by a little bit.
So I went looking for other sources of man-made heat, and added primary
heat from energy production, primary heat from deforestation, and net heat
resulting from agriculture. This brought
the heat observed in earth systems to less than the sources of anthropogenic
heat.
But the rapidly changing heat content of the ocean concerns
me, and makes me think that I have not yet captured all of the sources of
anthropogenic heat, or properly quantified heat from greenhouse gases. In particular, it seems to me that published
figures on radiative forcing are only considering the proportion of the sun’s
radiant heat which is retained in the atmosphere due to the greenhouse effect. However, greenhouse gases will affect all
out-going thermal radiation from earth.
Thus, geothermal heat will also be retained in the earth’s atmosphere by
greenhouse gases. Geothermal heat is a
steady-state process, adding about 1.4 x 10^21 joules to the earth’s heat
budget (about 10% of total anthropogenic heat).
I ignored geothermal energy in this study because it is constant. But if the amount of geothermal energy
retained in the atmosphere is changing due to greenhouse gases, I may need to
add additional heat to the analysis. Similarly,
natural biomass is a large part of the earth’s heat budget. Like geothermal heat, I assumed that it is
constant (except where displaced by agriculture). Presumably, heat from all natural biomass is
accounted for in the sun’s radiant heat, and therefore accounted for in the
radiative forcing figures published by NOAA.
But it might be worth a question for clarification.
Appendix II.
Assumptions for Global Heat Budget study:
I made a number of simplifying assumptions in order to calculate the global heat budget. Those assumptions are fairly sweeping in some cases, but all are based on reasoning, as explained below, and the results of the study are robust with respect to the simplifying assumptions made.
NOAA published data for radiative forcing for fifteen greenhouse gases other than CO2, for the years 1979 – 2016. I extrapolated the radiative forcing for these gases for the years 1979 – 1974, scaling the radiative forcing for non-CO2 gases proportionally with CO2 for the years 1955 – 1978, for Figures 17, 18 and 20.
I assumed that volumes of deforestation biomass decayed or were burned, generating heat according to the heat content of wood fuel with an initial moisture content of 50%. I used published figures for annual deforestation biomass through 2008, and assumed deforestation was constant at 2008 levels for all later years.
I assumed that net agricultural biomass was proportional to global population, and scaled reported biomass from 2009 for each year accordingly. I also arbitrarily assumed that agricultural biomass productivity was 50% greater than the natural productivity it displaced, allowing me to calculate the net heat attributable to agricultural production, in excess of natural biomass production. I assumed that the heat produced during decay is equal to the heat of combustion for wood, after corrections for moisture content. Moisture was assumed to be 50%. The heat of combustion for dry wood was used to calculate heat produced from dry agricultural biomass during decay.
I used a smooth 2nd order polynomial function for global ocean heat content (0 – 2000m). I created the function as a visual overlay on NOAA’s plot of heat content, as I was unable to obtain digital data from NOAA for this parameter.
I used smooth 2nd order polynomial functions for ice melt from Greenland, Antarctica and other Glaciers and Ice Sheets, created by visual overlays on a figure from Shuang, 2015. The functions for Antarctica and Greenland compare very well (about 10% higher) to digits available from NASA for the gravity-indicated mass losses from Greenland and Antarctica. Numerous papers document ice loss from other glaciers and ice sheets, but without documented volumetric data.
I estimated the thickness of “multi-year [‘old’] ice” as 2 meters, and “new ice” as 1 meter, in calculating loss of Arctic sea ice. Old ice diminished from 1,860,000 km2 in 1984 to only 110,00 km2 in 2016, a decline of 96%. (Imster, E., in EarthSky, Nov. 8, 2016). Declining areas of multi-year ice and new ice were calculated separately, and attributed as a constant annual average, resulting in an estimate of 145 gigatonnes of Arctic sea ice melted annually.
I assumed that all ice needed to be warmed 10 degrees C before melting. This figure was an eyeball estimate based on temperature profiles of ice cores in Antarctica and Greenland.
I used a figure for the heat capacity for the atmosphere from college physics lecture notes available on-line. I assumed that the temperature of the atmosphere changed proportionately with surface temperature when calculating atmospheric heat content. I would note that recent satellite studies have shown that the troposphere is cooling, perhaps as the result of greater water content. In any event, the bulk of the atmosphere’s mass, density and heat content are near the surface.
--
References:
Heat Sources
Greenhouse
Gases
James.H.Butler and Stephen.A.Montzka, 2017, THE NOAA ANNUAL GREENHOUSE GAS INDEX (AGGI),
NOAA Earth System Research Laboratory
Source for radiative forcing data used in greenhouse gas heat
calculations.
Fossil
Fuels
Conti, J., et al, 2013.
International Energy Outlook, U. S. Energy Information Administration,
Office of Energy Analysis, U.S. Department of Energy, Washington, D.C. DOE/EIA-0484(2013)
http://www.eia.gov/forecasts/ieo/
U.S. Energy Information Agency, Data Tables, U.S. Energy
Information Agency, Office of Energy Analysis, U.S. Department of Energy, Washington
D.C. data tables, 2014
Source for data on primary heat from fossil fuel and nuclear
energy.
Deforestation
Houghton, R.A. 2008. Carbon Flux to the Atmosphere from Land-Use
Changes: 1850-2005. In TRENDS: A Compendium of Data on Global Change. Carbon
Dioxide Information Analysis Center, Oak Ridge National Laboratory, U.S.
Department of Energy, Oak Ridge, Tenn., U.S.A.
Source for biomass used in calculation of primary heat generated
by deforestation. Volumes of
deforestation were assumed constant after 2008.
Adam Martin, 2011, A Reassessment of Carbon Content of Tropical Trees. Average carbon content of dry wood is
47.2%. This analysis includes volatiles,
determined by the process of freeze-drying, instead of heat-drying the wood.
Agriculture
UNEP, 2009, Converting Waste Biomass Into a Resource
Heat Sinks
Atmosphere
NASA, 2017, Global Annual Mean Surface Air Temperature Change
Tabular data and chart
Dennis Hartman, 2017, University of Washington, Heat capacity of
ocean, atmosphere and land.
Heat capacity of atmosphere used to calculate changing heat
content.
Oceans
NOAA, National Centers for Environmental Information
Source of charts used with overlays to generate smoothed functions
for ocean heat content and temperature.
Note: the charts showing average ocean temperature changes for 0 – 700
meters and 0 – 2000 meters were accessed on this site in June, 2017, but are no
longer available.
The ARGO system and the Jason altimeter system allow separation of
sea level rise into steric (heat & salinity; i.e. density) and mass
components. The steric component is
dominant over the mass component in regional sea level variability and on a
global basis it accounts for about 1/3 of total sea level increase in the past
half century (Domingues et al 2008).
specific heat of seawater = 3.9 joules/g
John Abraham, 2017, New study confirms the oceans are warming
rapidly, The Guardian.
Dr. John Abraham is a professor of thermal sciences. He researches
in climate monitoring and renewable energy generation for the developing world.
His energy development work has extended to Africa, South America and
Asia. “Global warming is really ocean
warming.”
Ice Melt
Greenland,
Iceland, and Antarctica
Shuang Yi, Wenke Sun, Kosuke Heki, and An Qia, 2015, An increase
in the rate of global mean sea level rise since 2010, Geophysical Research
Letters
NASA Global Climate Change, Vital Signs of the Planet
Source of charts and data tables for ice mass loss from Greenland
and Antarctica.
Contribution of ice sheet and mountain glacier melt to recent sea
level rise
J. L. Chen, C. R. Wilson, & B. D. Tapley
Arctic Sea
Ice
Imster, E., in EarthSky, Nov. 8, 2016, Decline of Arctic’s thickest sea ice. Multi-year ice grows up to 4 meters thick, while
single-year ice is 2 meters thick at most. The area covered by Arctic sea ice at least four years old has decreased from 1,860,000 square kilometres in September 1984 to 110,000 square kilometres in September 2016.