Take a deep breath. If you are about as old as I am, every breath you take now contains about 23% more CO2 than your first breath at birth, and about 40% more CO2 than when George Washington took his first breath. The Keeling Curve is a remarkable series of CO2 measurements taken at Mauna Loa, Hawaii, since 1957, showing a steadily rising CO2 trend, with an annual cycle of fluctuation. This article is an update to an earlier post regarding the Keeling Curve, found here: http://dougrobbins.blogspot.com/2011/05/keeling-curve.html

I began this exercise with a simple thought.
Ice cores from Antarctica provide a record of atmospheric composition and temperature (inferred from oxygen isotopes). There is a strong correlation between the concentration of Carbon Dioxide and temperature: high temperature corresponds to high CO2. The details of the correlation are interesting enough for another post, but for now, the correlation demands the simple question: Does CO2 cause global temperature to rise, or does high temperature cause high CO2?


 The seasonality and asymmetry of the cycles is quite apparent. In the Northern Hemisphere, CO2 falls


I began this exercise with a simple thought.
Ice cores from Antarctica provide a record of atmospheric composition and temperature (inferred from oxygen isotopes). There is a strong correlation between the concentration of Carbon Dioxide and temperature: high temperature corresponds to high CO2. The details of the correlation are interesting enough for another post, but for now, the correlation demands the simple question: Does CO2 cause global temperature to rise, or does high temperature cause high CO2?

Overlay of CO2 content and inferred Temperature from the Vostok ice core.
Horizontal scale is thousand years before present.
Modeling and physics suggests that CO2 drives temperature; and that CO2 accumulating from carbon emissions is causing global warming. On the other hand, the past thirty cycles of glaciation, occurring at intervals of about 100,000 years, are generally accepted to be caused by Milankovitch orbital cycles, which change the amount of solar radiation received by Northern Hemisphere land masses.

This suggests that orbital cycles drive temperature change; therefore temperature drives CO2 variation.
It occurred to me that the world conducts an annual experiment for us. The seasons change, for reasons that are well understood, and there is an annual change in CO2 concentrations. CO2 concentrations have been recorded since 1957 and documented by Charles Keeling, of the Scripps Institution of Oceanography. The usual presentation of the Keeling Curve shows only data recorded at Mauna Loa, in Hawaii.
The Scripps Institute sites are mostly located in the Pacific Basin, and range in latitude from 82.5 North to the South Pole. Additional data is available from Italy and the Indian Ocean. The following map shows the observation locations. Charts will generally be color-coded as shown below, with warm colors indicating stations in the Southern Hemisphere, and cool colors in the Northern Hemisphere.

There's a seasonal cyclicity to the data. In summer months, CO2 concentration falls in the Northern Hemisphere, suggesting rising temperature actually reduces CO2 concentration (at least on an annual time scale). We might expect to see the opposite polarity in the Southern Hemisphere, to confirm the hypothesis. But when I looked at the data, things became more complicated. The simple experiment failed. Let's look at the data.

This chart shows CO2 concentrations from fourteen stations, ranging in latitude from the South Pole to the Arctic Ocean. There is a remarkable consistency to the rising trend and cyclicity. An exponential curve can be fitted to the data. This black curve is an exponential function with a starting value of 281 ppm CO2 in the year 1800, which is close to the pre-industrial values for CO2 found in ice-cores in Antarctica and Greenland.

As an aside, the exponential function would forecast reaching a global CO2 concentration of 450 ppm by 2031. This level has been suggested as an irreversible tipping point by climate scientists.

We see some interesting features when we look at the data closely. Northern Hemisphere cycles are high amplitude, while the Southern Hemisphere is very low amplitude. The expected polarity reversal only occurs in high Southern latitudes (near the pole). Readings from latitudes less than 30 degrees south (near the equator; Kermadec Islands and American Samoa) share the polarity of the Northern Hemisphere.

We can the long-term trends to study the cyclicity more closely. I first subtracted the exponential function, and I then removed residual fluctuation (reflecting temporary events, such as the volcanic eruption of Mt. Pinatubo) by subtracting a 12-month moving average from the monthly data.
The resulting cycles are asymmetric. Negative excursions are roughly double the magnitude of positive excursions. Area under the curve has been normalized to zero, so this means that negative deflections are brief, compared to positive deflections. It is also easy to note that the cycle from the South Pole has an opposite polarity to the most of the other cycles.
This chart presents the normalized cycles by latitude. The horizontal scale is time; CO2 seasonal cycles are displayed at the appropriate latitude of the monitoring station which recorded the data.
A clear distinction can be seen. Cycles in the Northern Hemisphere are high amplitude, while those in the Southern Hemisphere are low amplitude.

Here is a closer look at cycles by latitude. The following chart expands the horizontal scale, showing only seven years of data.

As noted previously, polarity of the southernmost cycles (south of - 30 latitude) is reversed with respect to the Northern Hemisphere, but with much lower amplitude.
If we take readings in the southern hemisphere as the global baseline, it is clear that there are both positive and negative factors influencing the seasonal fluctuation in CO2 in the northern hemisphere.
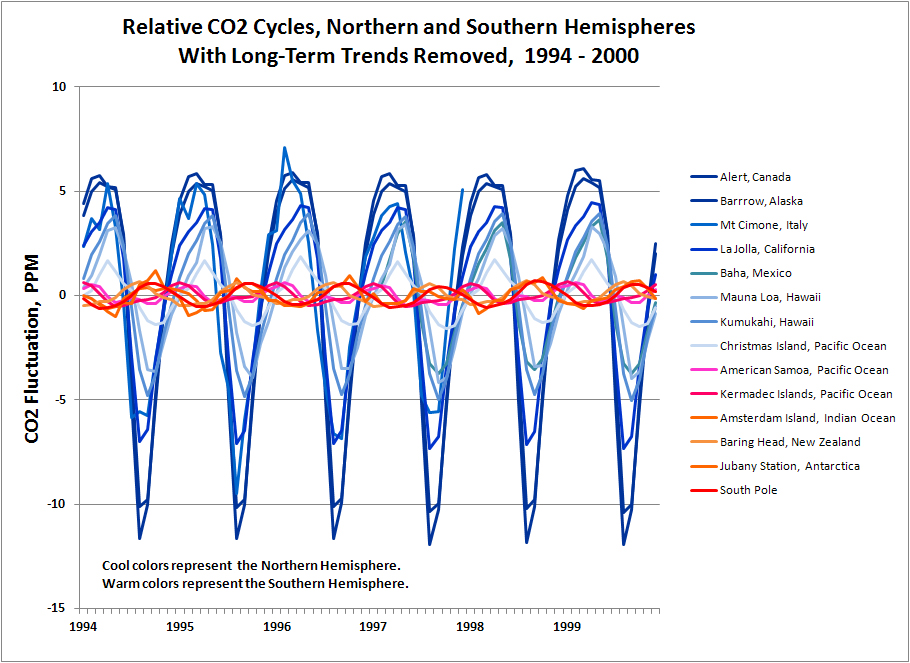
Close examination shows that cycles in the low southern latitudes (markers) share the polarity of the Northern Hemisphere. Also, the peak and trough of Northern Hemisphere cycles shifts slightly according to latitude, and the onset of seasons. In the fall, it seems clear that the early onset of winter causes an earlier trough at higher latitudes. But in the spring, it is not clear why high latitudes have an earlier peak than low latitudes. Both features may relate to the timing of atmospheric mixing between the hemispheres.
 The seasonality and asymmetry of the cycles is quite apparent. In the Northern Hemisphere, CO2 falls
sharply in the three months of summer, followed by an increase during the fall, winter and spring. The increase is initially sharp, then more gradual.

Northern Hemisphere cycles by season.

Southern Hemisphere cycles by season. The low amplitude is striking, relative to the Northern Hemisphere. The polarity reversal at low latitudes is also apparent.

The following chart is a plot of trough-to-peak amplitude by latitude.
Carbon dioxide concentration reflects many factors: fossil fuel usage, the natural carbon cycle of the biosphere, the influence of agriculture and livestock, the dissolution of limestones on land, and precipitation of limestone in the ocean. In this plot, the observed amplitude of CO2 fluctuation is shown by latitude.

The Northern Hemisphere contains about two-thirds of the world's land mass, and 90% of the world's populations, and a similar proportion of the world's agriculture. The prominent seasonal cyclic source for CO2 would be fossil fuel use, and the prominent seasonal sinks would be land plant growth, particularly agriculture. I hope to do the math or find the data, and compare the sources and sinks for CO2, and present the results in a new post. (By the way, the respiration of 7 billion human beings contributes about 950 million kg of excess CO2 to the atmosphere on a non-seasonal basis. We can also conclude that this volume (plus agricultural wastage) is a summer seasonal CO2 sink, due to agriculture. But there's probably a better way to get the number). For the moment, let's compare the amplitude of CO2 cycles to the distribution of population.

The bulk of the world's population lives in the Northern Hemisphere. Here's the chart of population, superimposed on the chart of the amplitude of CO2 cycles.

As we have seen, seasonal factors are concentrated in the highest latitudes, whereas the bulk of the population lives in middle latitudes. However, I suspect (as a director of an Alaskan electrical company) that seasonal fossil fuel usage is higher per capita in higher latitudes. Also, the curvature of the earth results in a smaller volume of atmosphere for dispersion. However, I do not have a chart for population density, or fuel usage by latitude.
Next, we should quantify the relationship between atmospheric carbon cycles, and annual cycles of emissions from fossil fuels. However, to my surprise, there is no source with monthly data for global fossil fuel emissions. Andres and others have published an study with hard data for 21 countries with the highest CO2 emissions, and extrapolated to the other countries with a Monte Carlo model. Here is the result of their study on CO2 emissions.

The annual cycle of emissions matches the annual cycles of CO2 observed the northern hemisphere.
Here is a similar chart for CO2 emissions from various sources in the United States.

We should ask whether the magnitude of CO2 emissions matches the magnitude of CO2 annual fluctuation.
It is a matter of simple math. There are 3160 gigatonnes of CO2 in the atmosphere. Estimates of annual CO2 emissions from fossil fuels range from 27 gigatonnes to 35 gigatonnes; about 1% of the total, if dispersed through the entire atmosphere, or currently about 3.8 ppm, out of 390 ppm. This is less than the observed cycles. However, at least 90% of emissions are delivered in the northern hemisphere, which would create an annual signal of 7.6 ppm. And finally, fossil fuels are consumed with a peak in winter. If we assume that 65% of annual emissions occur during 6 winter months of the year, the amplitude of cycles due to fossil fuel consumption would be about 10 ppm, approaching the amplitude of cycles seen in the middle latitudes of the Northern Hemisphere, including the United States. Of course, fossil-fuel CO2 emissions are not the entire story. The natural respiration of the biosphere must be added to the signal from fossil fuels. But the cyclicity of fossil fuel emissions appears to be of the right magnitude and timing to account for much of the positive CO2 fluctuation during winter months.
This chart shows the cyclicity of European gas consumption.

The last factor to consider as an influence on seasonal CO2 cycles is agriculture. Like landmass and population, agriculture is concentrated in the northern hemisphere.

Globally, 140 billion metric tonnes of biomass is generated from agriculture each year. Assuming 50% moisture content, and 45% carbon content of dry biomass, and converting from weight of carbon to carbon dioxide, we can calculate that 115 gigatons of CO2 is removed from the atmosphere during every growing season. This is roughly 4 times the volume of CO2 generated annually from fossil fuels. This is equivalent to a northern hemisphere, seasonal fluctuation of 37 ppm, about 3 times the amplitude of the largest observed cycles. If the given estimates are correct, agriculture is the dominant driver of CO2 cycles. The only surprise is that the cycles are not larger.
------------------------
This article is the second post in a series about Global CO2 trends and seasonal cycles. The final article consolidates and summarizes results of the previous posts.
1) The Keeling Curve
2) The Keeling Curve and Seasonal Carbon Cycles
4) Long-Term Trends in Atmospheric CO2
5) Modeling Global CO2 Cycles
6) The Keeling Curve Summary: Seasonal CO2 Cycles, and Global CO2 Distribution
http://dougrobbins.blogspot.com/2013/05/the-keeling-curve-seasonal-co2-cycles.html
----------------
All CO2 data in this article is credited to C. Keeling and other at the Scripps Institute of Oceanography, also Gaudry et al, Ciattaglia et al, Columbo and Santaguida, and Manning et al. The data can be found on the Carbon Dioxide Information Analysis Center; http://cdiac.ornl.gov/trends/co2/
World Background Map for charts courtesy ESRI.
The Milankovitch chart can be found on ClimateDataInfo: http://www.climatedata.info/Forcing/Forcing/milankovitchcycles.html
Vostok Ice Core charts can be found at a variety of sites. I created an overlay from the chart posted here: http://10ksnookers.blogspot.com/2011/02/coming-ice-age.html
The population chart was prepared by "Radical Cartographer" Bill Rankin. http://www.radicalcartography.net/
I used the version of the map posted here: http://www.geekosystem.com/world-population-latitude-longitude/
Andres, R.J. et al, 2011, Monthly, global emissions of carbon dioxide from fossil fuel consumption, Tellus B, 63B, 309-327.
Monthly CO2 emissions USA, from CDIAC. http://cdiac.ornl.gov/trends/emis_mon/graphics/graphics.html
Quarterly report on European Gas markets, EU commission, Market Observatory for Energy
Impressive analysis! Thank you for sharing the graphs as they can prove the rising carbon dioxide in the atmosphere. Great post.
ReplyDeleteI Finally Got Helped !! I'm so excited right now, I just have to share my testimony on this Forum.. The feeling of being loved takes away so much burden from our shoulders. I had all this but I made a big mistake when I cheated on my wife with another woman and my wife left me for over 4 months after she found out.. I was lonely, sad and devastated. Luckily I was directed to a very powerful spell caster Dr Emu who helped me cast a spell of reconciliation on our Relationship and he brought back my wife and now she loves me far more than ever.. I'm so happy with life now. Thank you so much Dr Emu, kindly Contact Dr Emu Today and get any kind of help you want.. Via Email emutemple@gmail.com or Call/WhatsApp cell number +2347012841542
DeleteDoug--extremely comprehensive analysis. How reliable are CO2 data before 1900 or so-- the ice cores? Are there any sources going back over 500 years or a millennia available? Why is CO2 a stronger green house gas than H2O? The correlation with El Nino is fascinating, and global distribution patterns. I have read of direct CO2 capture technology--does it have enough scale to make a difference? Wow!
ReplyDeleteHi Greg,
DeleteThe CO2 data before 1900 are primarily drawn from ice cores, supplemented by a few early atmospheric measurements of questionable accuracy. There are some critics who quibble with the ice-core data, because of the question of how much ice overburden is necessary to seal the bubbles. But for me, the ice-core data is validated by back-calculating CO2 concentrations based on estimates of how much fossil fuel we've burned since 1800. If we use the same ratio of fossil fuel CO2 retained in the atmosphere (44%) to atmospheric CO2, we land right on the pre-industrial CO2 concentration from the ice cores.
Free-air carbon capture technology is a big question, and would be a big project! I wonder if there would be an alternative bio-engineering solution -- building reefs, or algal blooms in anoxic basins.
just to comment the H2O-issue:
Deletenormally the process goes as follows: firstly (Milankovitch) the sun warm the ocean, the ocean contains CO2 dissolved which will be released with higher temperature of the water (like a bottle of mineral water). This due to greenhouse effect warms the ocean (and land) surface further until an equilibrium is reached. By the same token water wapor emanates (until it rains - 100% relative humidity). Water vapor is a much stronger greenhouse thus both gases (and possibly other gases) act in the same direction.
This in total is a feedback loop until equilibrium. Moreover there is melting ice at the poles (in particular Northpole sea ice) which starts another feedback loop increasing the icefree water with a small albedo ... which warms the planet further ... etc. etc. Hope I did not forget anything ... (errare humanum est)
Doug, I really like your analysis of the CO2 seasonal cycles. Have you see the research done in 2007 by Michigan State University that shows 1 acre of corn captures 36,000 pounds of CO2? Being a former Industrial Engineer and now a cattle farmer who gets blamed for global warming, I'm very interested in the tremendous amount of CO2 that is pulled from the atmosphere each year by the Mid-West Corn crop. Unfortunately most of this CO2 is released back into the atmosphere when the corn stover decays, but it seems if we harvest the entire above ground plant as silage & the roots decay without exposure to oxygen then most of the CO2 captured can be sequestered back into the ground. The plant fed to the cows as silage will end up as manure that is added back to the soil. Some CO2 is lost through the cows belching and farting but much is recaptured. My on farm analysis shows we are capturing about 5 pounds of Carbon for every 1 pound of meat we sell. Have you seen any research in this area? You can contact me at davefischer@hotmail.com.
ReplyDeleteThanks
Dave
We learn that the drivers of the fluctuations in the Keeling Curve are photosynthesis by plants in summer, and not fossil fuel emissions (I also think they are not that seasonal; maybe more the further towards the poles you go, but in general we're emititng too much in winter as well as in summer). Also, I'd like to think that the bulk of plants is still nature and not part of agriculture (also very important, because agricultural plants don't store CO2 whereas plants that remain do; as plants are used, the carbon is released (for example by people breathing or bodies decaying after their lifes have ended). Thus, the variations in the Keeling Curve are attributed to photosynthesis of the biosphere (https://en.wikipedia.org/wiki/Keeling_Curve in the results/interpretion section) in my opinion and Í'm pretty sure is also scientific consensus.
ReplyDeleteYour figures give a really nice overview of the information though, thanks for that!
And I'm aware this is a pretty old post, just came across it while googling differences between the southern and northern hemisphere with regards to the Keeling Curve and thought this information might contribute :)
EMERGENCY LOAN OFFER APPLY
ReplyDeleteWe Offer all types of Finance Business Personal Cash
Quick Cash Advance. Fast Credit Check. Cash Today.
Fast Cash Online
low interest rate as low as 2%
Financial Cash Available Here
Business Personal Cash
Solve Your Financial Problems
I'll advise All Cash seeker should contact us
THERE IS NOTHING TO LOSE BUT YOUR DEBT AND FINANCIAL PROBLEMS !!!
We Are Here To Show You A Better Way To Financial Freedom !!!
Contact Us At : abdullahibrahimlender@gmail.com
whatspp Number +918929490461
Mr Abdullah Ibrahim
Do you need a loan to pay off your bills? Or for your Business if yes Email us opploansllc@gmail.com then fill this information to register your name in our data base.
ReplyDelete(1)Your Name:
(2)Amount needed as loan:
(3)Phone number:
(4)Duration:
(5) Male/Female:
(6)Country
Regards.
.....................................................................................................................................................
ReplyDeleteAre you in financial crisis, looking for money to start your own business or to pay your bills?
I got mine from Mike Fisher. My blank ATM card can withdraw $2,000 daily. I got it from Her last week and now I have $14,000 for free. The blank ATM withdraws money from any ATM machines and there is no name on it, it is not traceable and now i have money for business and enough money for me and my family to live on .
GET YOUR BLANK ATM CREDIT CARD AT AFFORDABLE PRICE
*They sell this cards to all customers and interested buyers worldwide,the card has a daily withdrawal limit of $2000 to $5000 and up to $50,000 spending limit in stores and unlimited on POS.*
*email: blankatm156@gmail.com
*you can also call or whatsapp us Contact us today for more enlightenment
+1(301) 329-5298
this is kind of spam - and does not fit into a scientifically oriented blog - sorry to say that.
Deletethnks for this nice compendium. Really great figures, interesting or surprising the figures which correlate population, latitude and amplitude of CO2 content in the air ...
ReplyDeleteI Finally Got Helped !! I'm so excited right now, I just have to share my testimony on this Forum.. The feeling of being loved takes away so much burden from our shoulders. I had all this but I made a big mistake when I cheated on my wife with another woman and my wife left me for over 4 months after she found out.. I was lonely, sad and devastated. Luckily I was directed to a very powerful spell caster Dr Emu who helped me cast a spell of reconciliation on our Relationship and he brought back my wife and now she loves me far more than ever.. I'm so happy with life now. Thank you so much Dr Emu, kindly Contact Dr Emu Today and get any kind of help you want.. Via Email emutemple@gmail.com or Call/WhatsApp cell number +2347012841542
ReplyDeleteAfter being in relationship with Wilson for seven years,he broke up with me, I did everything possible to bring him back but all was in vain, I wanted him back so much because of the love I have for him, I begged him with everything, I made promises but he refused. I explained my problem to someone online and she suggested that I should contact a spell caster that could help me cast a spell to bring him back but I am the type that don’t believed in spell, I had no choice than to try it, I meant a spell caster called Dr Zuma zuk and I email him, and he told me there was no problem that everything will be okay before three days, that my ex will return to me before three days, he cast the spell and surprisingly in the second day, it was around 4pm. My ex called me, I was so surprised, I answered the call and all he said was that he was so sorry for everything that happened, that he wanted me to return to him, that he loves me so much. I was so happy and went to him, that was how we started living together happily again. Since then, I have made promise that anybody I know that have a relationship problem, I would be of help to such person by referring him or her to the only real and powerful spell caster who helped me with my own problem and who is different from all the fake ones out there. Anybody could need the help of the spell caster, his email: spiritualherbalisthealing@gmail.com or WhatsApp him +15068001647
ReplyDeleteyou can email him if you need his assistance in your relationship or anything. CONTACT HIM NOW FOR SOLUTION TO ALL YOUR PROBLEMS
Curve DAO Token (CRV) memiliki projek yang bagus
ReplyDeleteHow To Get Your Ex Lover/Partner/Boyfriend/Girlfriend/Wife Or Husband Back
ReplyDeleteI was married for 16 years to a loving mother and wife. We had 2 children together who are now 11 & 13. I reconnected with an old girlfriend from college on Facebook and we began an affair and I left my wife. The woman I had an affair with is a wonderful woman and I love her too and our kids had begun accepting the situation and my wife has kind of moved on, but not in love with the man she is seeing. I thought I fell out of love with my wife and I felt terrible about what I did to her - she is a good woman and I don't know what came over me. I decided to try and get her back and I was recommended to Lord Zakuza for help to get reunited with my wife and within 48 hours after I made contact with Lord Zakuza my wife decided to work things out with me and now we are back together with our children living as one happy family. I really don't know the words to use in appreciation of what Lord Zakuza did for me but I will say thank you sir for reuniting I and my family back. For those in trying times with their marriages or relationship can communicate with LORD ZAKUZA through the below informations.
Website via: lordzakuzaspells.com
WhatsApp/call/text: +1 740 573 9483
Email: Lordzakuza7 @gmail. com
To anyone out there who thinks love spells don't work, I’m here to tell you that Lord Zakuza love spell is the best and most powerful. I am a wealthy man who has lots of assets and possessions but I have difficulty with women. Whenever I try to settle down with any, we end up breaking up and I had no idea of why I was going through such an experience in my relationship. It was so worrying that I couldn’t be myself anymore and I started searching for help everywhere even at my place of work. I was going through my work activities online and I came across a testimony of a lady called ( Febe Anouk ) regarding how Lord Zakuza helped her to restore her relationship with his love spell, I had to give it a try because I needed my Ex lover back that I love so much. I visited Lord Zakuza website online and I told him everything I was going through. Lord Zakuza consoled me and promised to help me out with my situation by preparing a love spell for me. I followed the instructions given by him to me and within 48 hours, my Ex lover came looking for me and pleaded for forgiveness. Since I came in contact with Lord Zakuza, things have changed for good in my life and right now, I am married with two beautiful kids and my home is blessed. All thanks to Lord Zakuza I am forever thankful to you. Visit his website for any help via lordzakuzaspells.com or WhatsApp him on +1 740-573-9483. Try him and your life will be blessed.
ReplyDeleteDo you need an urgent loan of any kind? Loans to liquidate debts or need to loan to improve your business have you been rejected by any other banks and financial institutions? Do you need a loan or a mortgage? This is the place to look, we are here to solve all your financial problems. We borrow money for the public. Need financial help with a bad credit in need of money. To pay for a commercial investment at a reasonable rate of 3%, let me use this method to inform you that we are providing reliable and helpful assistance and we will be ready to lend you. Contact us today by email: daveloganloanfirm@gmail.com Call/Text: +1(501)800-0690 And whatsapp: +1 (501) 214‑1395
ReplyDeleteNEED A LOAN?
Ask Me.
Buy a fake GED diploma, certificate or transcript that looks real at a great ... best fake GED maker and THE source for the most realistic fake GED
ReplyDeletebuy ged online
buy a ged, buy a real ged
buy a ged certificate
buy ged certificate online contact us via any of the below details.
passportsservices247@gmail.com
Telegram=@Passportsservicese
https://t.me/joinchat/NNLD9_LDZH9mMjY0
PLEASE READ!!!
ReplyDeleteDo not fall into the hands of scammers all in the name of investing in cryptocurrencies.
I lost half of my life savings to one Mr Jerry from the USA. He promised to help me make profits every week then I started
to invest with him and at the end I got nothing as profits.
Thank God i came across Mr Anderson Johnny , Mr Anderson is a spanish man base in U.K he helped me make good and
reasonable amount of profits from cryptocurrency even as I write now I'm still doing business with him without having any
fear in mind of losing my money because he always explain things to me in a way I understand the interesting part of them
all is that he is into cryptocurrency investment and forex trading option.
*stop giving your hard earned money to scammers!!!
Contact Mr Anderson today he will give you all the info you need to know about cryptocurrencies and at the same time he
can help you make life changing profits bit by bit Whatsapp Him : (+447883246472 )or Email: tdameritrade077@gmail.com