As I’m writing this post, Hurricane Ophelia is forecast to
hit Ireland, the first full-strength hurricane to hit the island since
1961, and the tenth consecutive storm this season to reach hurricane strength. The year 2017 has already been a
tragic and record-setting Atlantic hurricane season. Hurricane Harvey hit Texas as a 1000-year
rainstorm, dropping about 11 cubic miles of rain on Houston with enough
weight to depress the earth’s crust by a measured 2 centimeters. And within a period of two weeks, Hurricanes
Irma and Maria struck the Caribbean Islands as category 5 hurricanes – the strongest measure on the Saffir-Simpson scale, setting a record for the duration of category 5 storms in one
season.
The obvious question is whether climate change is causing an increase in the frequency or intensity of these storms.
The obvious question is whether climate change is causing an increase in the frequency or intensity of these storms.
--
Hurricanes and Climate
Change
A hurricane is a convection engine. Warm tropical waters convey heat and humidity
to the air over the water. The warm,
humid air is light, and begins to rise at random spots over the ocean. The warm air cools as it rises, dropping
below the dew point. Water vapor
condenses to form clouds and rain. The
condensation of water vapor reduces air pressure, further lowering the air
density. The low-pressure center draws
warm air from the ocean surface toward itself, which feeds the rising
convection column.
The converging air currents are affected by the Coriolis
force, and begin to spin as they approach the growing low-pressure center. As the storm develops structure, a downward
current of air forms as the eye in the center of the storm, returning dry air from
high altitude. The hurricane eyewall of
clouds, rain and ferocious winds spins around the central eye. Surrounding the eye, spiral rain bands
develop as subsidiary convection systems, with upward air flow in the rain
bands and downward flow between those bands.
The strength of a hurricane is often limited by high-level
winds blowing across the top of the hurricane.
Strong high-level winds effectively decapitate a hurricane by blowing
the top off of the convection column. Hurricanes
tend to drift westward in equatorial waters, as the globe spins eastward
beneath them; and to drift toward the poles in temperate latitudes. Areas of surrounding high and low pressure
form steering currents, which modify the path of the hurricane as it drifts
across the globe.
Climate change is expected to increase the intensity of
hurricanes in a number of ways. Here are seven ways in which climate change is expected to make hurricanes worse.


Modified after image by Thompson Higher Education.
Temperature
1) Average surface air temperature has risen around the globe
by about one degree Celsius since 1980.
The particular warming is variable at different times and places, and
may be greater over tropical waters at times.
Warmer surface air creates a greater tendency to form thermal convection
currents.
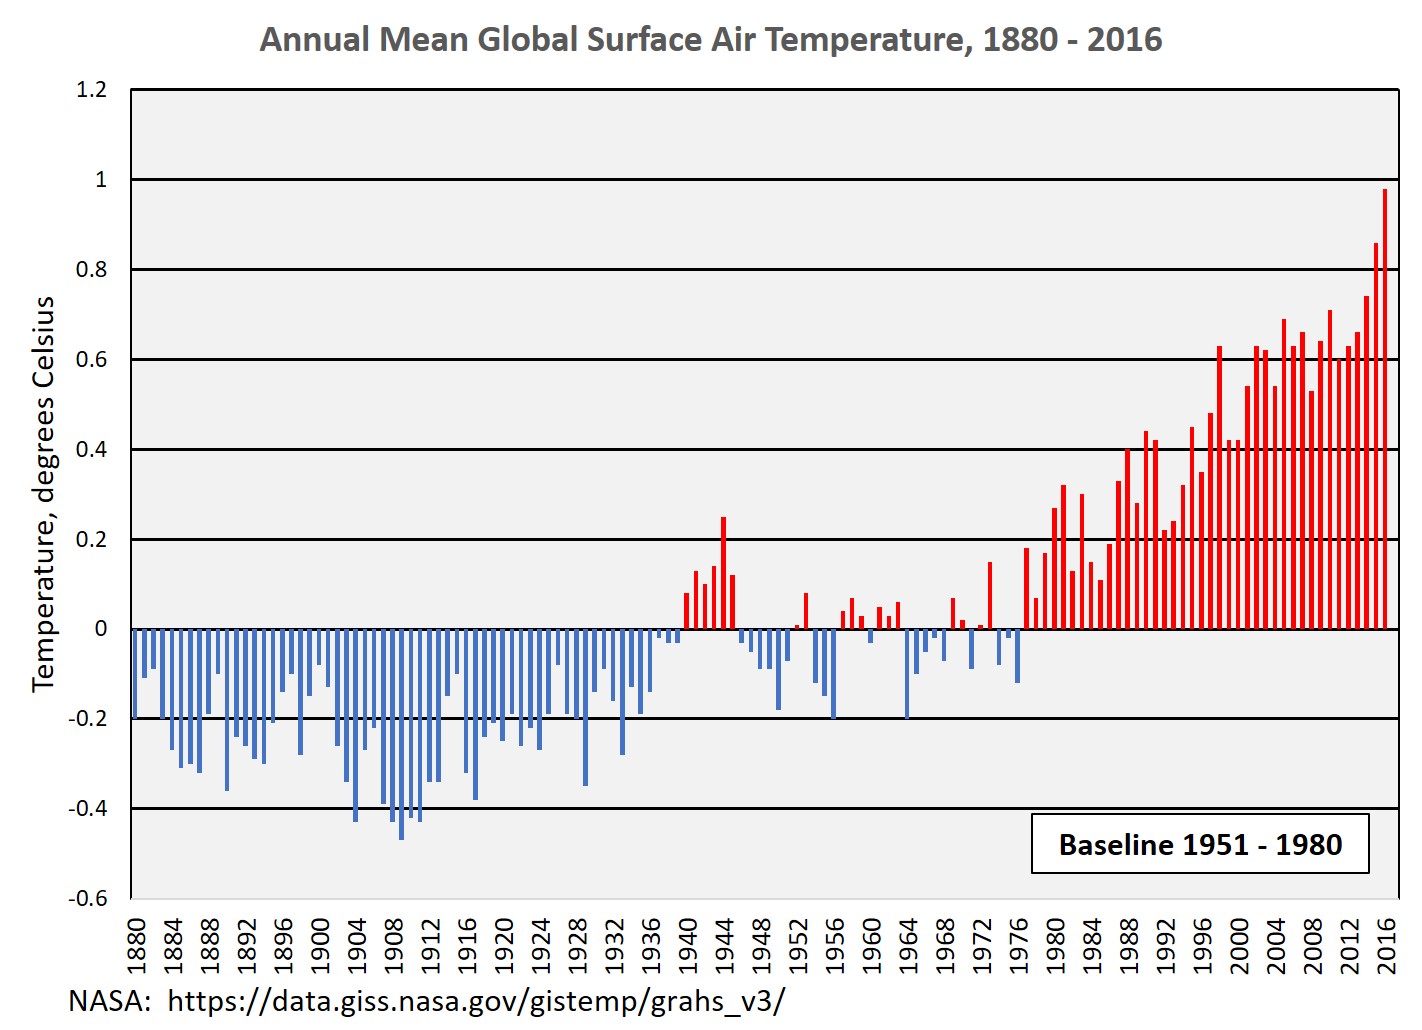
Average annual global surface temperature, 1880 - 2016. Image credit NASA.
2) Average temperature in the upper 100 meters of the ocean has
risen by ½ degree Celsius since 1980. As
with air, temperatures in the ocean vary seasonally and in complex patterns of
time and space. At times, tropical
waters will be warmer by more than the average ½ degree Celsius global
average. A warmer ocean surface
contributes more heat and humidity to a hurricane.

Average water temperature, 0-100 meters, 1955-2017. Image credit NOAA.
3) The average temperature of the ocean water at depth has also risen. The average temperature of waters from the surface to 700 meters has risen by 1/10 of a degree Celsius since 1980. Waters from 100 to 200 meters have warmed nearly as much as surface waters. Hurricane waves churn up deeper water, bringing cooler water to the surface. In the past, this stirring of deeper water cooled the ocean surface, and acted as a buffer on the intensity of a hurricane. But now that deeper waters are also warmer, there is less tendency for wave action to moderate the strength of a hurricane.

Average water temperature, 0 - 700 meters, 1955 - 2107. Image credit NOAA.
Humidity
The principles of physics mean that higher air temperatures
and higher water temperatures mean that more humidity is carried in tropical
air before the formation of a tropical storm.
Warmer air raises the water-carrying capacity according to the principle
of relative humidity, and higher water temperatures raise the humidity of the
air according to the Clausius-Clapeyron equation. Higher humidity acts in three ways to
increase the intensity of a hurricane.
4) Higher humidity lowers the density of the air,
because the water molecule is lighter than the average molecular weight of
air. Intuitively, we tend to think that
moist air is “heavy”, perhaps because liquid water seems heavy. But the molecular weight of water is 20,
while the molecular weight of nitrogen is 28, and oxygen is 32, giving dry air
a molecular weight of about 29.
Molecules of water vapor occupy just as much space as gaseous molecules
of nitrogen or oxygen, thus lowering the density of air. [If we had a bucket of liquid water and a
bucket of liquid air, the liquid air would be heavier.] Lighter air contributes to stronger
convection, which strengthens the hurricane.
5) Air with higher humidity has more moisture to
condense, causing a stronger drop in air pressure. This can lead to stronger winds and more
rapid intensification of a hurricane.
6) Higher humidity raises the water-carrying capacity of
the hurricane, and contributes to higher volumes of rainfall and flooding when
a hurricane makes landfall. The unusual
volumes of rainfall associated with hurricanes Harvey and Maria probably
reflect higher humidity caused by climate change.
Winds
7) Finally, it is possible that climate change has reduced the
strength of high-level winds, reducing the tendency for these winds to blow the
tops off of hurricanes. Some scientists
have observed a decline in the strength of high-level winds in recent years,
and tentatively suggest that this may be a result of climate change. However, the mechanisms by which climate
change would affect these winds is unclear, and the proposal is still
controversial.
Quantification
I wrote to “Ask a Climate Scientist” on Facebook, and asked
whether satellite data from NASA’s GOES satellites documented higher humidity
over the Atlantic since the 1980s, either in actual hurricanes or in general
background humidity. I wanted to know if
the data supported the idea that climate change is making hurricanes worse. Here’s the answer I received:
"The GOES imager series involve technology upgrades and are not well calibrated, and so are not well suited for measuring changes in water vapour over time.
However,
the HIRS instrument aboard the NOAA polar orbiter series which began about the
same time is fairly well calibrated, and does show increases in humidity.
More
recently the microwave radiometers on board the AMSU series of satellites also
show the increases, as does the global radiosonde and surface-observing
networks. The increases are in line with
expectations from thermodynamic principles (the Clausius-Clapeyron equation)
and climate models.
We
are pretty confident that these increases are indeed causing a storm to dump
more rain now than it would have a few decades ago, all other things being
equal.”
Professor
Steve Sherwood, Climate Change Research Center, UNSW Australia
I made a brief attempt to quantify changes in the hurricane
system in the Gulf of Mexico that are due to climate change. Assuming a 1.5 degree rise in sea surface
temperature, humidity will rise by about 5 percent, from about 75% relative
humidity to 80%, at an average daily temperature of 80 degrees F. Along with rising humidity, air temperatures
have risen by about 2 degrees F (global average). Air density will fall, but not very much,
only about ½ of one percent. This will
result in stronger convective activity, but I do not have the knowledge or
modeling ability to translate that change into hurricane intensity.
When water vapor in the air is converted to rain, air
pressure drops. Higher initial humidity will
lower air pressure in the center of the hurricane. This means stronger rotation and stronger
winds. Hurricanes are incredibly
efficient at removing humidity from the air.
Almost all of the surface humidity in a hurricane is converted to rain,
as convection drops the temperature of the air from 80 degrees Fahrenheit at the
surface to minus 130 degrees F at the cloud tops. But the initial saturation pressure of water
in air is fairly small. At 86 degrees F
and 80 percent humidity, air contains only 3.3 percent water vapor. Although climate change has raised the
humidity by 5 percent, this means that the surface air in a hurricane now
contains 3.5 percent water vapor. When
the vapor is converted to rain, the difference in air pressure is 0.2
percent.
So, temperature and humidity reduce the air density in a
hurricane by 0.5%; additional rain reduces the air pressure by another 0.2 %,
for a total climate-change reduction in air pressure of 0.7%.
Conclusion
Climate change produces higher temperature and humidity. Those changes push the physical processes of
a hurricane toward stronger convection, more rapid intensification, higher wind
speeds, and greater rainfall.
Quantifying those changes is difficult. Without sophisticated modeling, it is impossible
to say whether the small changes in air density and water vapor can result in a
major change to a storm system. But it
is important to note that hurricanes are feedback systems. Hurricanes start as a mild swirl of air over
the water, or a rain squall no different than any other rain squall. But like the proverbial “butterfly effect”, a
small change in the initial conditions of the hurricane may result in profound
changes in the ultimate intensity of the storm.
Feedback mechanisms in the convection system create the hurricane; it
would not be surprising if those same feedback mechanisms amplify the small
changes due to climate change to create monster storms.
I am generally critical of strictly empirical reasoning in
science. Science is about providing
explanations, identifying, observing and measuring processes which change the
world. But empirical evidence can
support scientific reasoning, and give a clue that an explanation is on the
right track. Currently, the remarkable
2017 hurricane season is supporting the notion that Climate Change is producing
stronger, more frequent storms, with more rapid intensification and heavier
rain.
--
References:
Temperature of cloud tops -90 degrees C.
Chart showing mass of water contained in air at 50% and 100%
humidity, as a function of temperature.
Air with 80% humidity at 86 degrees Fahrenheit contains
about 21 grams of water per kilogram of air.
Tells us there is a roughly 3 percent increase in average
atmospheric moisture content for each 0.5 degrees Celsius of warming
Air density calculator
Average annual humidity for places in Texas.
Average annual humidity for places in Florida.
Temperature change for mid-Gulf surface waters, 1975 to the
present. Average temperatures have
increased by 1.5 degrees F; high temperatures have increased by about 3 degrees
F.
Average Gulf of Mexico air temperatures, by month.
Mass of water in air at 50% and 100% humidity, as a function
of temperature.
Hurricane facts.
Cloud top temperatures for hurricane Ingrid, 2013.
Partial pressure of water in saturated air, as a function of
temperature.
Standard Air Pressure
14.70 psi
1013.25 millibars
Air Density @ 80 F & 75% humidity: 1.166 kg/m3
Air Density @ 82 F & 80% humidity: 1.16 kg/m3
Personal Communication from Profesoor Steve Sherwood,
Climate Change Research Center, UNSW, Australia:
"The GOES imager
series involve technology upgrades and are not well calibrated, and so are not
well suited for measuring changes in water vapour over time.
However, the HIRS instrument aboard the NOAA
polar orbiter series which began about the same time is fairly well calibrated,
and does show increases in humidity.
More recently the microwave radiometers on
board the AMSU series of satellites also show the increases, as does the global
radiosonde and surface-observing networks.
The increases are in line with expectations from thermodynamic
principles (the Clausius-Clapeyron equation, https://en.wikipedia.org/wiki/Clausius%E2%80%93Clapeyron_relation) and
climate models.
We are pretty confident that these increases
are indeed causing a storm to dump more rain now than it would have a few
decades ago, all other things being equal."
Real time and archived statistics on global cyclone energy.


