Rome Didn't Fall in A Day.


Objective Truth Exists and is Accessible to Everyone.

All Human Problems can be Solved with Enough Knowledge, Wealth, Social Cooperation and Time.


Photo: Rusty Peak, Anchorage, Alaska


Translate

Showing posts with label Hurricane Harvey. Show all posts

Monday, July 21, 2025

Extreme Precipitation and the July 4h Texas Hill Country Flood

Central Texas recently experienced a storm with extreme rainfall, leading to flash-flooding in a number of rivers, particularly the Guadalupe River, a popular recreational river.  The storm happened over the July 4th holiday, when the campgrounds and RV parks near the river were crowded with families out for the holiday, and hundreds of children were enjoying summer camp beside the river.  The flood was sudden and savage, sweeping down the river at 4 am, with the river level rising 26 vertical feet in 45 minutes, sweeping away buildings, cabins, RVs, cars, and people.  At the last count, different sources indicate that between 135 and 145 people are confirmed to be dead.  Preliminary estimates of property damage are around $20 billion.  

I don’t want to talk about the emergency planning, the lack of an effective notification system, the lack of an evacuation order, or delays in the search and rescue emergency response.  I want to talk about the rain.  

Within days of the central Texas floods, there were unrelated flooding events in New Mexico, North Carolina, New Jersey, Illinois and New York.  There were fatalities due to flooding in New Mexico, North Carolina and New Jersey.  Property damage is extensive.  The floods in parts of New Mexico, North Carolina and Illinois were considered 1000-year flood events.  All of the floods were due to extreme rainfall events.  

Climate Report Warnings
There have been six international and five U.S. major climate reports in the past 35 years.  We have been warned repeatedly – human CO2 emissions cause more frequent and severe  extreme rainfall events, due to high temperatures of the air and ocean surface.  Twenty-five years ago, the 1st National Climate Assessment said this:

“Droughts and flash floods are likely to become more frequent and intense….It is very likely that more rain will come in heavy downpours, increasing the risk of flash floods….Floods, especially those related to flash floods from intense short-duration heavy rains, are likely to increase in magnitude or frequency in many regions….Future climate scenarios show likely increases in the frequency of extreme precipitation events, including precipitation during hurricanes.”

The 2017 5th National Climate Assessment is more strident in delivering that warning, adding detail about what regions are most at risk, notably  in the Appalachians and Texas Hill Country.  When global warming reaches 2.0 C above pre-industrial levels, the Appalachians and Hill Country will see increases between 25% and 50% in the heaviest rainfalls.  In a recent article, the commercial weather service Accuweather put it plainly:  “Climate change from fossil fuel pollution is amplifying the conditions that make flash floods more likely and more severe.”

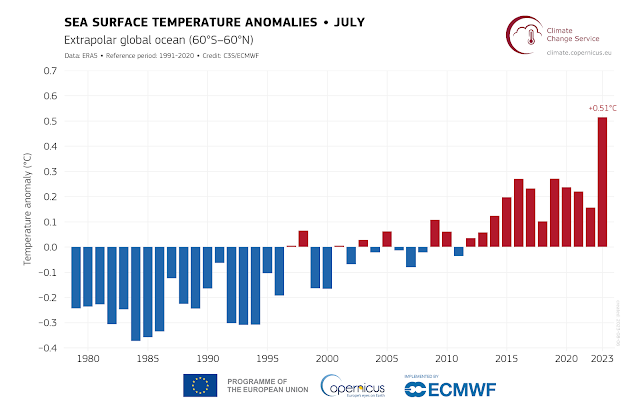
In 2025, global air and sea temperatures are clearly higher than twenty-five years ago.  Global humidity has increased, and heavy rainfall events have already increased in frequency and severity.  Sea surface temperatures are particularly important in causing extreme rainfall events.  Global sea surface temperatures are about 2 degrees F (1 degree C) warmer than the 20th century average, and about 1 degree F warmer than the average for 1971 – 2000.  Tropical systems now carry more moisture, due to higher sea and air temperatures.  When those systems move inland, more severe rainfall and flooding occur.  It’s worth noting that the 2025 central Texas flooding developed out of the remnants of tropical storm Barry, and 2025 flooding in North Carolina was from tropical storm Chantal.  Other recent catastrophic floods include 2024 flooding in Asheville, N.C. from Hurricane Helene (>107 deaths, $60 billion in damages) and the 2017 flooding in Houston from Hurricane Harvey (103 deaths and $125 billion in damages related to inland flooding).  Coastal areas are most at risk, with repeated flooding events from ocean-born humidity in Texas, Louisiana, Florida, and the Carolinas.  But areas far inland are also subject to extreme rains from the remnants of tropical storms, such as the 2016 flooding in Utah and the 2024 flooding in Tennessee. 

Attribution Studies
It’s difficult to attribute the cause of any specific weather event.  Attribution studies require months of study and have ranges of uncertainty in the results.  Undoubtedly, there will be studies of the July 4th flooding in Texas, but results may not be available for a year.  However, we already know that atmospheric water content was 7% higher than any previous, similar storm.  It seems certain that climate change played a role in the severity of the rainfall and flooding.

In 2016, a year before Hurricane Harvey flooded Houston, the Associated Press reported that extreme downpours had doubled in frequency in the preceding three decades, and that Houston already ranked badly in every category of repeated flood losses.  Houston’s flood-control infrastructure was built decades earlier, for less severe flood conditions.  When the flooding from Harvey occurred in 2017, the volume of water exceeded the flood control capacity by about 30%.   Attribution studies after the disaster concluded that between 15% and 38% of the flood volume was attributable to climate change, with 30% as the most likely volume.  In short, climate change was responsible for the >100 deaths and $125 billion dollars in damages from Hurricane Harvey.  

Similarly, attribution studies of Hurricane Helene show that climate change increased the volume of the  record rainfall, and greatly increased the likelihood of the extreme rainfall.  NOAA modeling shows that the regions most likely to see increased rainfall in coming decades are in Appalachia and the Texas Hill Country.  (See figures at the end of the article.)  Both areas are already prone to flash-flooding, due to topography.  

Between 2001 and 2019, Houston experienced four storms that exceeded the 100-year flood threshold derived from prior rainfall statistics.  Two of those storms exceeded the 1000-year flood threshold.  

Following Hurricane Harvey, FEMA and NOAA increased the 100-year, 24 hour rainfall amount for Houston, revising the 100-year flood plains.  Today, nearly a decade later, those estimates may already be obsolete, and will need to be revised upward again.

Global Impact
Flooding is now a pervasive fact of life in the United States and around the world.  Rainfall records studied by the non-profit group Climate Central show that hourly rainfall rates have grown heavier in nearly 90% of large US cities since 1970.  A few days ago Accuweather published a warning that 33 states are at risk of localized flooding this week, with 21 states at “greatest risk” for flooding.  There is currently flooding in the UK and Italy; ten European countries were impacted by flooding in 2024.  India, Pakistan, Bangladesh, China, Nepal, South Korea and Indonesia have all recently experienced severe flooding.  A quick Google search shows reports of record flooding in Africa, with over 100 fatalities in South Africa last month, and catastrophic flooding in Argentina and Brazil. 

In 2025, the National Weather Service has issued a record-setting 3050 flash-flood warnings through July 15th, with 706 warnings issued in the first two weeks of July.  Yesterday, a friend posted a go-fund-me request to benefit a young man in New Jersey, who lost everything he owned in recent flooding.  And an hour ago, my son in Maryland sent me a video of a flooding river near his home, flowing over a pedestrian bridge we’ve often used.

Trump Administration Approach to Climate Change
The Trump administration is in denial about climate change.  The administration closed down the Office of Global Change, created by Congress in 1990 to study and deliver reports on climate change.  The administration also removed all of the climate reports from government servers, reneging on a pledge made just a few weeks ago to keep those documents available.  The administration closed the office which kept an accounting of damage from climate-change disasters. The administration terminated development of a NOAA forecasting tool which would take changing climate into consideration in forecasting heavy rain and flooding.  The administration ended support for a variety of programs to develop alternatives to CO2 emissions, and implemented policies to make low-carbon solar and wind energy development more difficult.  In view of the decades of climate warnings, and the increasing frequency and severity of climate-change driven disasters, the actions of the Trump administration are completely irresponsible.

Conclusion
I spent my career finding oil and natural gas, which were needed to fuel our economy.  But like buggy-whip manufacturers of the past, times change.  The climate damage from fossil fuels is increasing, and we need to adopt alternatives to mitigate future disasters.

Global air and sea temperatures will continue to rise until we reach zero greenhouse gas emissions.  Realistically, that will not happen in my lifetime, or possibly in my children’s lifetimes.  We are already at 1.5 degrees C above pre-industrial levels.  (It was the target of the initial 2017 Paris agreement to keep temperatures below that threshold.)  We are almost certain to exceed 2.0 degrees C, and likely to approach 3.0 degrees C before reaching zero greenhouse gas emissions.  Extreme flooding and other climate disasters are certain to become worse as temperatures rise.  

The only question is how many children’s lives, adult lives, and how much property damage must occur before we seriously begin to address climate change.  Jim Blackburn is a Rice University scholar and author of three reports on Houston’s readiness for extreme flooding, following on the impact of Hurricane Harvey.  Blackburn writes, ““For too many years we debated whether climate change was happening. We now accept it but face great challenges in countering this local and global threat. We have wasted enough time.”


Water vapor in the atmosphere has risen measurably in recent decades, as predicted in climate reports since 1990.  Higher levels of atmospheric moisture increase the likelihood and severity of extreme rainfall events, and consequent flooding.
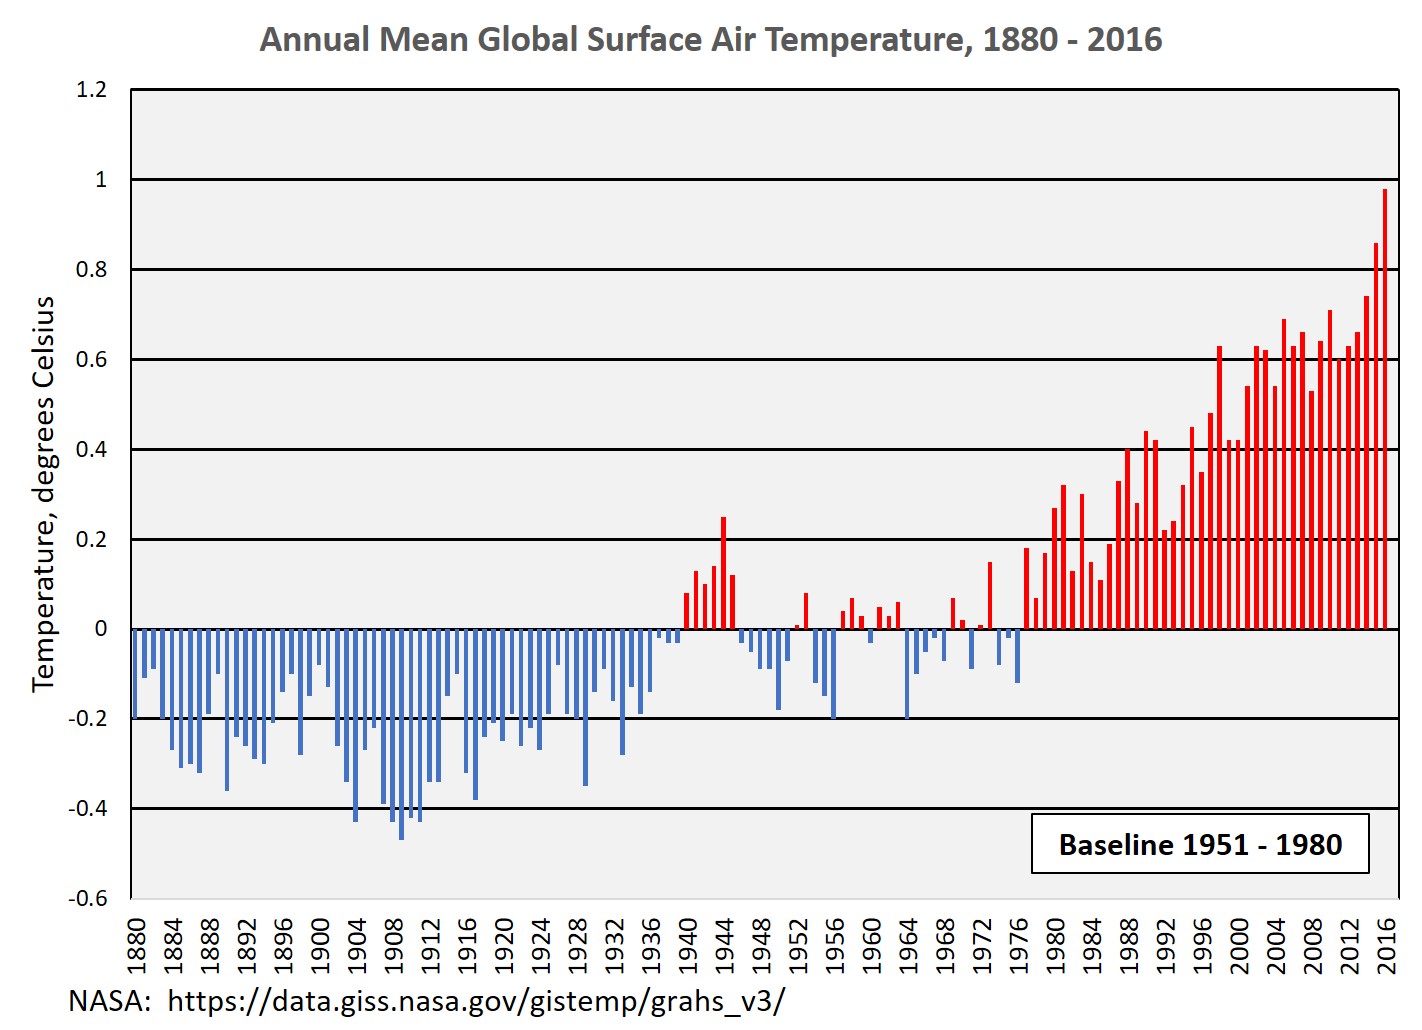
Atmospheric temperature have risen steadily since the 1970s, due to increasing concentrations of greenhouse gases, primarily CO2.
Sea surface temperatures have risen dramatically in recent years, adding to atmospheric moisture content.

Sea surface temperatures have risen dramatically in recent years, adding to atmospheric moisture content.

Forecast of increased frequency of heavy rain at 2 degrees C above pre-industrial temperatures, relative to a baseline of the years 1991 - 2000.  We are currently at 1.5 degrees C above pre-industrial levels. Note that Appalachia and the Texas Hill Country, already prone to flash-flooding due to topography, will experience some of the largest increases in heavy precipitation in coming decades, due to rising temperatures.  This figure is found on page 2 - 25 of the 5th National Climate Assessment, which is no longer available on the GlobalChange.gov website.  The Office of Global Change, in the US State Department, was created in 1989, and closed on the order of Donald Trump in 2025.
 
References
1st, 2nd, 3rd, 4th and 5th National Climate Assessments – These documents have been removed from public access on GlobalChange.gov by the Trump administration.  The administration pledged to keep these reports available on the NASA website, but reneged on that pledge.  Some, but not all, of the documents may still be available by searching the NOAA archives. 
 
NCA1,2000, Report Overview, Climate Change Impacts on the United States; The Potential Consequences of Climate Variability and Change
P. 4
…all climate models suggest that the climate is going to get warmer, the heat index is going to rise, and precipitation is more likely to come in heavy and extreme events. This consistency lends confidence to these results.
P. 7
Over the 20th century, the average annual US temperature has risen by almost 1°F (0.6°C) and precipitation has increased nationally by 5 to 10%,mostly due to increases in heavy downpours.  These trends are most apparent over the past few decades. The science indicates that the warming in the 21st century will be significantly larger than in the 20th century…. This [temperature] rise is very likely to be associated with more extreme precipitation and faster evaporation of water, leading to greater frequency of both very wet and very dry conditions.
P. 10
Heavy and extreme precipitation events are likely to become more frequent, yet some regions will get drier.
p. 11
It is also very likely that there will be more precipitation overall, with more of it coming in heavy downpours. In spite of this, some areas are likely to get drier as increased evaporation due to higher temperatures outpaces increased precipitation.  Droughts and flash floods are likely to become more frequent and intense.
P. 13
As the Earth warms, more water evaporates from the oceans and lakes, eventually to fall as rain or snow.  During the 20th century, annual precipitation has increased about 10% in the mid- and high-latitudes.
P. 22
In both the Hadley and Canadian models, most regions are projected to experience an increase in the frequency of heavy precipitation events.
P. 39
Warmer and moister air will very likely lead to more intense rainfall events, increasing the potential for flash floods.
P. 54
the projected increase in very heavy precipitation events will likely lead to increased flash flooding and worsen agricultural and other non-point source pollution as more frequent heavy rains wash pollutants into rivers and lakes.

NCA1, 2001, Full Report, Climate Change Impacts on the United States; The Potential Consequences of Climate Variability and Change
P. 10 
Droughts and flash floods are likely to become more frequent and intense.
P. 11
It is very likely that more rain will come in heavy downpours, increasing the risk of flash floods.
P 423 
Floods, especially those related to flash floods from intense short-duration heavy rains, are likely to increase in magnitude or frequency in many regions.
P. 445
Future climate scenarios show likely increases in the frequency of extreme precipitation events, including precipitation during hurricanes.
 
NCA5, 2017, Fifth National Climate Assessment
Overview 1-16
As the world’s climate has shifted toward warmer conditions….Many other extremes, including heavy precipitation,…flooding…are becoming more frequent and/or more severe, with a cascade of effects in every part of the country.
Overview 1-23
More frequent and intense heavy precipitation events are already evident, particularly in the Northeast and Midwest.
Overview 1-24
Heavy rain and more frequent storms damage crops and property and contaminate water supplies.
Overview 1-41
…more rain falls during the most extreme precipitation events. 
2-5
heavier precipitation and increased flood risk across much of the US are linked to rising temperatures.  Scientists cannot rule out the possibility of still more dramatic shifts if certain tipping elements trigger rapid and irreversible changes….Put simply, communities across the country are built for a climate that no longer exists.
2-10
Global average temperatures over the past decade (2012-2021) were close to 2F (1.1C) warmer than the preindustrial period (1850-1899).  This warming has been accompanied by several large-scale changes:…increases in atmospheric humidity, shifting rainfall patters and more frequent heavy precipitation….
2-11
The Characteristics of Precipitation Are Changing
2-18
Rainfall is Becoming More Extreme
Since the 1950s, there has been an upward trend in heavy precipitation across the contiguous US (Figure 2.8)  This increase is driven largely by more frequent precipitation extremes, with relatively smaller changes in their intensity.
There is robust evidence that human-caused warming has contributed to increases in the frequency and severity of the heaviest precipitation events across nearly 70% of the U.S.  
2-19
Maps show observed changes in three measures of extreme precipitation: (a) total precipitation falling on the heaviest 1% of days, (b) daily maximum precipitation in a 5-year period, and (c) the annual heaviest daily precipitation amount over 1958-2021.
2-20
The complexes of thunderstorms that bring substantial precipitation to the central United States during the warm season have become more frequent and longer-lasting over the past two decades.
2-24
The Frequency and Severity of Heavy Precipitation Increases with the Global Warming Level
Extreme precipitation-producing weather systems ranging from tropical cyclones to atmospheric rivers are very likely to produce heavier precipitation at higher global warming levels.  Recent increases in the frequency, severity and amount of extreme precipitation are expected to continue across the U.S. even if global warming is limited to Paris Agreement targets.  
2-25
Note: In the U.S., the largest changes to precipitation falling on the heaviest 1% of days at a global warming level of 2C will occur in the Appalachians and the Texas Hill Country, with increases of 25% to 50% compared to the period 1991 to 2020.  
2-26
Even in regions that experience an overall decrease in precipitation, atmospheric rivers are projected to become stronger and wider, increasing the risk of downpours and floods across the Western United States.
It is likely that the frequency of weather environments that give rise to severe thunderstorms in the United States during spring and fall will increase under stronger warming scenarios.  These changes are likely to lengthen the severe thunderstorm season as the world warms, especially in the Midwest and Southeast during cool-season months. 
2-35
Long-term changes have been observed in many other aspects of the climate system.  Seasonal average and extreme precipitation changes are widely documented using observations, and changes are consistent with our physical understanding.

https://www.ipcc.ch/reports/
IPCC climate assessment reports #1 through #6 can still be found on the IPCC website.

https://en.wikipedia.org/wiki/Hurricane_Helene
Hurricane Helene

https://en.wikipedia.org/wiki/Hurricane_Harvey
Hurricane Harvey

https://en.wikipedia.org/wiki/July_2025_Central_Texas_floods
Texas Hill Country July 4th, 2025 flooding

https://web.archive.org/web/20170910032838/https://apnews.com/5b28b342061344d7ad6e7395a56e7cce/climate-change-runaway-development-worsen-houston-floods
Warning that heavy rainfall events had doubled, published a year before Hurricane Harvey.

https://www.accuweather.com/en/severe-weather/is-the-us-seeing-worse-flooding-this-summer-heres-whats-happening/1793836
Accuweather notes that extreme rainfall and flash-flooding events have occurred this month in five states, with deaths occurring in four of those states.  Two states experienced 1:1000 probability rainfall events.  Accuweather plainly says that climate change due to fossil-fuel emissions cause warmer air to hold more water, causing extreme rainfall.
 “Climate change from fossil fuel pollution is amplifying the conditions that make flash floods more likely and more severe.”

https://www.accuweather.com/en/weather-forecasts/flash-flood-dangers-far-from-over-as-storms-reload-across-us/1795199
Accuweather says that 33 states are for localized flooding this week; with 21 states at “greatest risk” for for flooding.

https://www.propublica.org/article/texas-flash-flood-camp-mystic-climate-change-trump-noaa-fema
The Texas Flash Flood Is a Preview of the Chaos to Come

https://www.cnn.com/2025/07/18/weather/flash-flooding-west-gulf-east-climate
“Hourly rainfall rates have grown heavier in nearly 90% of large US cities since 1970, according to a study from the nonprofit research group Climate Central.”

https://www.eea.europa.eu/en/topics/in-depth/extreme-weather-floods-droughts-and-heatwaves
Europe extreme weather

https://disasterphilanthropy.org/disasters/2024-central-and-eastern-europe-floods/
Central and Eastern Europe Flooding

https://wmo.int/news/media-centre/extreme-weather-and-climate-impacts-bite-latin-america-and-caribbean
Latin American extreme weather

https://www.epa.gov/climate-indicators/climate-change-indicators-sea-surface-temperature
Sea Surface Temperature

https://ourworldindata.org/grapher/sea-surface-temperature-anomaly
Global Average Sea Surface Temperature

https://climate.copernicus.eu/global-sea-surface-temperature-reaches-record-high
Global Average Sea Surface Temperature

https://www.climate.gov/maps-data/dataset/global-temperature-anomalies-graphing-tool
Links to a variety of climate data and maps.

https://www.rmets.org/metmatters/world-exceeds-15degc-threshold-entire-year-first-time
Atmospheric Temperature Chart

https://www.bakerinstitute.org/sites/default/files/2018-08/import/bi-pub-blackburnharveyanniv-081018.pdf
Houston a Year After Harvey: Where We Are and Where We Need to Be

https://www.bakerinstitute.org/research/houston-flooding-35-years-after-harvey
Houston Flooding 3.5 Years After Harvey

https://www.bakerinstitute.org/research/assessing-houstons-flood-vulnerability-6-years-after-harvey
Assessing Houston’s Flood Vulnerability 6 Years After Harvey 


Thursday, October 12, 2017

Seven Ways Climate Change Makes Hurricanes Worse

As I’m writing this post, Hurricane Ophelia is forecast to hit Ireland, the first full-strength hurricane to hit the island since 1961, and the tenth consecutive storm this season to reach hurricane strength.  The year 2017 has already been a tragic and record-setting Atlantic hurricane season.  Hurricane Harvey hit Texas as a 1000-year rainstorm, dropping about 11 cubic miles of rain on Houston with enough weight to depress the earth’s crust by a measured 2 centimeters.  And within a period of two weeks, Hurricanes Irma and Maria struck the Caribbean Islands as category 5 hurricanes – the strongest measure on the Saffir-Simpson scale, setting a record for the duration of category 5 storms in one season. 

The obvious question is whether climate change is causing an increase in the frequency or intensity of these storms. 
--
Hurricanes and Climate Change
A hurricane is a convection engine.  Warm tropical waters convey heat and humidity to the air over the water.  The warm, humid air is light, and begins to rise at random spots over the ocean.  The warm air cools as it rises, dropping below the dew point.  Water vapor condenses to form clouds and rain.  The condensation of water vapor reduces air pressure, further lowering the air density.  The low-pressure center draws warm air from the ocean surface toward itself, which feeds the rising convection column.

The converging air currents are affected by the Coriolis force, and begin to spin as they approach the growing low-pressure center.  As the storm develops structure, a downward current of air forms as the eye in the center of the storm, returning dry air from high altitude.  The hurricane eyewall of clouds, rain and ferocious winds spins around the central eye.  Surrounding the eye, spiral rain bands develop as subsidiary convection systems, with upward air flow in the rain bands and downward flow between those bands. 

The strength of a hurricane is often limited by high-level winds blowing across the top of the hurricane.  Strong high-level winds effectively decapitate a hurricane by blowing the top off of the convection column.  Hurricanes tend to drift westward in equatorial waters, as the globe spins eastward beneath them; and to drift toward the poles in temperate latitudes.  Areas of surrounding high and low pressure form steering currents, which modify the path of the hurricane as it drifts across the globe.

Climate change is expected to increase the intensity of hurricanes in a number of ways. Here are seven ways in which climate change is expected to make hurricanes worse.
Modified after image by Thompson Higher Education.

Temperature
1)  Average surface air temperature has risen around the globe by about one degree Celsius since 1980.  The particular warming is variable at different times and places, and may be greater over tropical waters at times.  Warmer surface air creates a greater tendency to form thermal convection currents.
Average annual global surface temperature, 1880 - 2016.  Image credit NASA.

2)  Average temperature in the upper 100 meters of the ocean has risen by ½ degree Celsius since 1980.  As with air, temperatures in the ocean vary seasonally and in complex patterns of time and space.  At times, tropical waters will be warmer by more than the average ½ degree Celsius global average.  A warmer ocean surface contributes more heat and humidity to a hurricane.

Average water temperature, 0-100 meters, 1955-2017.  Image credit NOAA.

3)  The average temperature of the ocean water at depth has also risen.  The average temperature of waters from the surface to 700 meters has risen by 1/10 of a degree Celsius since 1980.  Waters from 100 to 200 meters have warmed nearly as much as surface waters.  Hurricane waves churn up deeper water, bringing cooler water to the surface.  In the past, this stirring of deeper water cooled the ocean surface, and acted as a buffer on the intensity of a hurricane.  But now that deeper waters are also warmer, there is less tendency for wave action to moderate the strength of a hurricane. 
Average water temperature, 0 - 700 meters, 1955 - 2107.  Image credit NOAA.

Humidity
The principles of physics mean that higher air temperatures and higher water temperatures mean that more humidity is carried in tropical air before the formation of a tropical storm.  Warmer air raises the water-carrying capacity according to the principle of relative humidity, and higher water temperatures raise the humidity of the air according to the Clausius-Clapeyron equation.  Higher humidity acts in three ways to increase the intensity of a hurricane.

4)  Higher humidity lowers the density of the air, because the water molecule is lighter than the average molecular weight of air.  Intuitively, we tend to think that moist air is “heavy”, perhaps because liquid water seems heavy.  But the molecular weight of water is 20, while the molecular weight of nitrogen is 28, and oxygen is 32, giving dry air a molecular weight of about 29.  Molecules of water vapor occupy just as much space as gaseous molecules of nitrogen or oxygen, thus lowering the density of air.  [If we had a bucket of liquid water and a bucket of liquid air, the liquid air would be heavier.]   Lighter air contributes to stronger convection, which strengthens the hurricane.

5) Air with higher humidity has more moisture to condense, causing a stronger drop in air pressure.  This can lead to stronger winds and more rapid intensification of a hurricane.

6) Higher humidity raises the water-carrying capacity of the hurricane, and contributes to higher volumes of rainfall and flooding when a hurricane makes landfall.  The unusual volumes of rainfall associated with hurricanes Harvey and Maria probably reflect higher humidity caused by climate change.

Winds
7) Finally, it is possible that climate change has reduced the strength of high-level winds, reducing the tendency for these winds to blow the tops off of hurricanes.  Some scientists have observed a decline in the strength of high-level winds in recent years, and tentatively suggest that this may be a result of climate change.  However, the mechanisms by which climate change would affect these winds is unclear, and the proposal is still controversial. 

Quantification
I wrote to “Ask a Climate Scientist” on Facebook, and asked whether satellite data from NASA’s GOES satellites documented higher humidity over the Atlantic since the 1980s, either in actual hurricanes or in general background humidity.  I wanted to know if the data supported the idea that climate change is making hurricanes worse.  Here’s the answer I received:

"The GOES imager series involve technology upgrades and are not well calibrated, and so are not well suited for measuring changes in water vapour over time. 
However, the HIRS instrument aboard the NOAA polar orbiter series which began about the same time is fairly well calibrated, and does show increases in humidity. 
More recently the microwave radiometers on board the AMSU series of satellites also show the increases, as does the global radiosonde and surface-observing networks.  The increases are in line with expectations from thermodynamic principles (the Clausius-Clapeyron equation) and climate models. 
We are pretty confident that these increases are indeed causing a storm to dump more rain now than it would have a few decades ago, all other things being equal.”
Professor Steve Sherwood, Climate Change Research Center, UNSW Australia

I made a brief attempt to quantify changes in the hurricane system in the Gulf of Mexico that are due to climate change.  Assuming a 1.5 degree rise in sea surface temperature, humidity will rise by about 5 percent, from about 75% relative humidity to 80%, at an average daily temperature of 80 degrees F.  Along with rising humidity, air temperatures have risen by about 2 degrees F (global average).  Air density will fall, but not very much, only about ½ of one percent.  This will result in stronger convective activity, but I do not have the knowledge or modeling ability to translate that change into hurricane intensity. 

When water vapor in the air is converted to rain, air pressure drops.  Higher initial humidity will lower air pressure in the center of the hurricane.  This means stronger rotation and stronger winds.  Hurricanes are incredibly efficient at removing humidity from the air.  Almost all of the surface humidity in a hurricane is converted to rain, as convection drops the temperature of the air from 80 degrees Fahrenheit at the surface to minus 130 degrees F at the cloud tops.  But the initial saturation pressure of water in air is fairly small.  At 86 degrees F and 80 percent humidity, air contains only 3.3 percent water vapor.  Although climate change has raised the humidity by 5 percent, this means that the surface air in a hurricane now contains 3.5 percent water vapor.  When the vapor is converted to rain, the difference in air pressure is 0.2 percent. 

So, temperature and humidity reduce the air density in a hurricane by 0.5%; additional rain reduces the air pressure by another 0.2 %, for a total climate-change reduction in air pressure of 0.7%. 

Conclusion
Climate change produces higher temperature and humidity.  Those changes push the physical processes of a hurricane toward stronger convection, more rapid intensification, higher wind speeds, and greater rainfall. 

Quantifying those changes is difficult.  Without sophisticated modeling, it is impossible to say whether the small changes in air density and water vapor can result in a major change to a storm system.  But it is important to note that hurricanes are feedback systems.  Hurricanes start as a mild swirl of air over the water, or a rain squall no different than any other rain squall.  But like the proverbial “butterfly effect”, a small change in the initial conditions of the hurricane may result in profound changes in the ultimate intensity of the storm.  Feedback mechanisms in the convection system create the hurricane; it would not be surprising if those same feedback mechanisms amplify the small changes due to climate change to create monster storms. 

I am generally critical of strictly empirical reasoning in science.  Science is about providing explanations, identifying, observing and measuring processes which change the world.  But empirical evidence can support scientific reasoning, and give a clue that an explanation is on the right track.  Currently, the remarkable 2017 hurricane season is supporting the notion that Climate Change is producing stronger, more frequent storms, with more rapid intensification and heavier rain.
--
References:
Temperature of cloud tops -90 degrees C.

Chart showing mass of water contained in air at 50% and 100% humidity, as a function of temperature.
Air with 80% humidity at 86 degrees Fahrenheit contains about 21 grams of water per kilogram of air.

Tells us there is a roughly 3 percent increase in average atmospheric moisture content for each 0.5 degrees Celsius of warming

Air density calculator

Average annual humidity for places in Texas.

Average annual humidity for places in Florida.

Temperature change for mid-Gulf surface waters, 1975 to the present.  Average temperatures have increased by 1.5 degrees F; high temperatures have increased by about 3 degrees F.

Average Gulf of Mexico air temperatures, by month.

Mass of water in air at 50% and 100% humidity, as a function of temperature.

Hurricane facts. 

Cloud top temperatures for hurricane Ingrid, 2013.

Partial pressure of water in saturated air, as a function of temperature.

Standard Air Pressure
14.70 psi
1013.25 millibars
Air Density @ 80 F & 75% humidity:  1.166 kg/m3
Air Density @ 82 F & 80% humidity:   1.16 kg/m3

Personal Communication from Profesoor Steve Sherwood, Climate Change Research Center, UNSW, Australia:
"The GOES imager series involve technology upgrades and are not well calibrated, and so are not well suited for measuring changes in water vapour over time.  

However, the HIRS instrument aboard the NOAA polar orbiter series which began about the same time is fairly well calibrated, and does show increases in humidity. 

More recently the microwave radiometers on board the AMSU series of satellites also show the increases, as does the global radiosonde and surface-observing networks.  The increases are in line with expectations from thermodynamic principles (the Clausius-Clapeyron equation, https://en.wikipedia.org/wiki/Clausius%E2%80%93Clapeyron_relation) and climate models. 

We are pretty confident that these increases are indeed causing a storm to dump more rain now than it would have a few decades ago, all other things being equal."

Real time and archived statistics on global cyclone energy.

Friday, September 22, 2017

Flooding in Houston: Hurricane Harvey and Climate Change

September 2017 has been an active and violent hurricane season in the Atlantic tropical zone.  Most of this post was written following Hurricane Harvey, and before Hurricanes Irma and Maria.  Hurricane Harvey dumped record-setting volumes of rain on the south Texas coast.  Hurricanes Irma and Maria, occurring in a two-week period, were the strongest hurricanes on record in the open Atlantic Ocean.  For many years, researchers have warned that climate change would produce stronger hurricanes -- it seems that the future has arrived.

In the simplest analysis, I would ask the following question.  Is it more likely that Hurricane Harvey was a completely natural, unlikely event with a probability of 1:1000, or is it more likely that the storm was made worse by climate change, according to well-understood physical principles and predicted by scientists for over two decades? 

------
In August 2017, Houston Texas became the face of climate change.   More than 20 inches of rain fell over an area of 28,949 square miles; > 30 inches over 11,492 square miles; and > 40 inches over 3643 square miles.  The maximum rainfall of 52 inches broke the record for rainfall from a single storm in the contiguous United States.  The intensely flooded area received 11 ½ cubic miles of water.  Within a few days, over 300,000 people had already filed claims for federal disaster assistance, and many more are likely to require assistance in the future.  The immediate death toll from the storm was 82, and illnesses relating to the storm are expected to persist for years.
Total Rainfall from Hurricane Harvey, August 30, 2017 

Climate change is often represented in terms of polar bear on melting ice; of changing migration patterns for wildlife; of seemingly trivial changes in long-term average temperatures; of higher sea level in the next century.  All of those are true and real.  But for many Americans, these issues do not impact their lives.  None of this matters in terms of day-to-day living. 

Hurricane Harvey is different.  It has been called a 1000-year flood by scientists.  This is an expression of the probability of an event of this magnitude in a given year, based on statistics of smaller events.  The storm dropped an awe-inspiring quantity of water on the earth, and America’s fourth-largest city was totally disrupted.  There was certainly no economic productivity from the city for a week, and the damages are considerable.  When floodwaters threatened to destroy Houston's earthen flood-control dams, emergency managers opened the floodgates, deliberately flooding neighborhoods downstream of the dams, to save other neighborhoods in a kind of triage.  An estimated 100,000 homes were flooded or damaged by the storm.  Many of them will be totally destroyed after sitting in flood waters for a month.  The human toll in lives and economic loss is huge. 

The damage is personal to me; two of my three former houses in Houston almost certainly flooded. Old friends and former neighbors are dealing with the loss of their homes, cars, and lifelong possessions. A number of deaths occurred in familiar neighborhoods
Image credit Joe Raedle/Getty Images
Image credit: David J. Phillip, AP
Image Credit: T.B. Shea, AFP/Getty
Image credit: AP

Climate Change: Prediction and Consequences

The Intergovernmental Panel on Climate Change (IPCC) 2014 Report includes this statement: “It is very likely that heat waves will occur more often and last longer, and that extreme precipitation events will become more intense and frequent in many regions.”

On August 27, 2017, the National Weather Service tweeted this statement regarding Hurricane Harvey: “This event is unprecedented & all impacts are unknown & beyond anything experienced. Follow orders from officials to ensure safety.  #Harvey”.   [Emphasis mine.] 

These statements are not unrelated. 

Scientific Analysis
The full scientific analysis of Hurricane Harvey will not be known for a long time, probably years.  And uncertainties will remain after the full analysis of all available data.  There are a number of known factors relating to climate change which will increase hurricane severity – it is simply physics.  These factors include higher temperatures at the ocean surface, higher temperatures in the upper 200 meters of the ocean, and higher humidity.  The factors are well-established -- the changing temperature of ocean waters have been observed by NOAA’s ARGO system of buoys since 2004, and by satellite since the 1980s.  Some scientists have also suggested that climate change is reducing the strength of upper level winds, though this proposal is not yet considered proved.

Higher temperatures at the ocean surface are believed to have caused a rapid, late intensification of the storm from category 2 to category 4 immediately before landfall. 

Higher temperatures in the water column are believed to have reduced the tendency of wave action to bring cooler water to the surface, weakening the hurricane.  

Higher humidity, relating to higher water temperatures and higher air temperatures, allowed the storm to carry more water than other storms.  Higher humidity and higher temperatures also lower air density, contributing to the strength of convection and wind speed.

At this time, it is unknown how much wind systems have changed due to climate change, or how much these changes might have affected Hurricane Harvey.  Hurricane Harvey stalled after moving onshore, caught between stationary high-pressure systems.   High-level winds, which sometimes reduce convection through wind shear, were also weak through the hurricane.  Quantifying these impacts using new observations and modeling is the job ahead for scientists. 

The specific magnitude of these changes is unknown, but the known factors contributing to the severity of the hurricane are clear.  According to one preliminary estimate, factors relating to climate change increased the volume of rainfall from Hurricane Harvey by 30%.   While this may seem to be only a moderate increment, thirty percent of extra water is what exceeded the capacity of flood-control reservoirs, caused neighborhoods to flood, and caused a number of deaths.

Conclusion
The earliest warning that climate change could result in more frequent and severe hurricanes was published in 1992, and incorporated into the IPCC Second Assessment Report.  At that time, there was sparse statistical evidence that hurricanes were becoming worse.  In 2017, statistical evidence is still weak.  However, science is not all about empiricism.  Explanations matter.  We understand the physical processes of hurricane convection, the Coriolis effect, and the importance of water temperature, air temperature, humidity and air density.  We have observed that these factors are changing due to accumulating greenhouse heat, and will increase the frequency and intensity of hurricanes.

At this time, we do not know the specific amount that climate change contributed to the Hurricane Harvey disaster.  But there is a simple, shortcut analysis that we can do now.  Simply consider which possibility is more likely: whether Hurricane Harvey was an extreme event with a probability of 1:1000, or whether climate change intensified an ordinary storm, as predicted by scientists for over twenty years?


 Graphical Representation of 1:1000 Probability Event
 -------------
References
http://www.npr.org/2017/09/01/547598676/at-least-100-000-homes-were-affected-by-harvey-moving-back-in-wont-be-easy

Long-term temperature is about one degree higher than a few decades ago.    Local conditions were 2.7 degrees to 7.2 degrees F higher than usual.   Humidity rises at about 3 percent per degree C., so humidity during Harvey was 3% to 5% higher than usual.
High level winds that typically steer tropical storms collapsed in 2010.  Although a meteorologist expects the winds to return in a few years, long-term climate modeling suggests that collapse of steering currents may become more common.    

Speech by Mike Pence


Immediately prior to landfall, and during the time of intensification to category 4, Harvey over water 4 degrees F warmer than average.

Waters off South Texas were 5 degrees warmer than usual during Hurricane Harvey.

Warm water extended deeper into the water column.

Atlantic Decadal Oscillation is trending to cooler temperatures, which may bring cooler waters to the tropics and weaken storms in coming years.   Another researcher suggests that GHG warming may keep the ADO positive for the coming decade.

Background conditions were about 2 degrees warmer than average, and then warmed further by an eddy of the Gulf Stream Loop Current.

“The human contribution can be up to 30 percent or so of the total rainfall coming out of the storm”.  Hurricane waves usually bring cooler water to the surface, which acts as a buffer to moderate the strength of the storm.  But Hurricane Harvey churned up water 100 m to 200 m below the ocean surface, but this water was still warm. 

Graphics representing 27 trillion gallons (about 25 cubic miles) of water. 

Probability of Hurricane Harvey, based on historical statistics, is 1:1000.


Immediate death toll from Hurricane Harvey was 82.  A number of serious health effects could persist for years. 

Daniel Huber, Jay Gulledge, Center for Climate and Energy Solutions, Extreme Weather and Climate Change, 2011.
“There is a physical basis for expecting hurricanes to have stronger winds and produce more rainfall due to global warming, and models with enhanced greenhouse gas levels show an increase in the number of such storms….However, observational evidence is insufficient to confirm that such a response has already begun.”

IPCC Second Assessment Report, 1995.
"Direct impacts on infrastructure would most likely occur as a result of changes in the frequency and intensity of extreme events. These include coastal storm surges, floods and landslides induced by local downpours, windstorms, rapid snowmelt, tropical cyclones and hurricanes, and forest and brush fires made possible in part by more intense or lengthier droughts."
“It is presently uncertain whether the frequency and severity of tropical cyclones will increase due to climate change.”

O'Brien, S.T., B.P Hayden, and H.H. Shugart, 1992: Global climatic change, hurricanes, and a tropical forest. Climatic Change , 22 , 1750-1790.