Much of the work presented below was performed and published by Jean Laherrere, co-author of a seminal paper "The End of Cheap Oil", published in Scientific American in 1998. Mssr. Laherrere is a member of the Association for the Study of Peak Oil. Many thanks for the availability of his work. Links are shown below.
Abstract:
Historical trends in oil exploration ("creaming curves") provide a basis for forecasting the volume of future oil discoveries. Historical trends strongly indicate diminishing returns with time and exploration effort (number of exploration wells). Extrapolation of regional and global trends provides good agreement, that about 170 billion barrels of new reserves will be discovered by the year 2030, or about 200 billion barrels including heavy oil. By comparison, projected production and consumption greatly exceed the forecast of new discoveries, with about 770 billion barrels expected to be produced and consumed. Production by the year 2030 will exceed the volume of new reserves discovered by about 4-fold. There is no reasonable extrapolation of historical discovery trends that would allow reserve replacement on a global scale.
-----
The history of oil exploration shows certain statistical trends which can be eused to predict future results. Historical results reflect the intersection of markets, engineering, available capital, political and geographical boundaries, and the geologic occurrence of oil in the earth. Despite huge improvements in engineering and exploration technology; increased exploration drilling; and the exploration of deep water, remote, and arctic regions, the total volume of new oil discoveries has been declining since the 1960's. Although new technologies have improved the rate of exploration success; the size of newly discovered fields has become smaller, in a 50-year continuous trend.
New technologies for oil exploration and production will undoubtedly emerge. But will the new technologies of the current generation have any greater impact than the new technologies of the previous generation? It seems to me that the volume of new oil discoveries continue to decline, reflecting the geologic availability of oil, and limits on the accumulation of physical capital. Let's look at the data, and see what we can predict according to the extrapolation of historical trends in oil exploration.
There are a couple of basic laws of oil exploration, which are virtually never violated.
First law: Within any given area, there are very few large fields, and very many small fields. (Geologists say that oil field sizes follow a log-normal or parabolic fractal statistical distribution.) The existence of a large field implies the existence of small fields nearby. In my experience in oil development in the Gulf of Mexico, smaller satellite fields always occurred in the neighborhood of a large field. As a rule of thumb, I found that the small, satellite fields surrounding a large field would add an incremental 40% or 50% to the reserve potential of the large field. Like fractals, oil fields occur in self-similar patterns independent of scale.
Second Law: Within a given area, fields are generally discovered in rank order according to size. Large fields are easier to find, and geologists usually find the biggest fields first. Here is a figure showing the history of gas discoveries in shallow water of the Gulf of Mexico.
Figure 1. Gas fields discovered in shallow water (U.S. waters) of the Gulf of Mexico, by discovery year. Bubble size indicates field size (ultimate recoverable reserves).
Large fields were found beginning in the earliest days of offshore exploration, and diminishing field sizes followed. A dramatic fall-off in the size of new field discoveries occurred in the mid-1980’s. The industry’s continuing efforts in shallow-water exploration were essentially wasted, considering the expense of the exploration effort and the results achieved. The single large recent discovery in the shallow water gulf of Mexico is the Davy Jones discovery at a depth of about six miles. The energy return on energy invested (EROI), and the economic return in exploring for such targets remains in question, in my opinion.
Another figure from the Gulf of Mexico shows the decline in oil-field size over time, even as more fields are discovered. Although more fields are being discovered, the total volume of newly discovered hydrocarbons diminishes. The energy return and economic return from those discoveries are usually subject to diminishing returns.
Figure 2. Number of discovered fields (bar graph) and mean field size (line) by discovery year; Gulf of Mexico.
The global plot of average field size over time shows the same thing. With increasing maturity and technology, success rates rise, but field sizes diminish. Overall, discovery volumes diminish with time, as we have previously seen in discussions of peak oil.
Figure 3. Global average oil field size and exploration success ratio, by discovery year.
Another presentation of the diminishing field sizes is a cumulative graph of reserves discovered. The graph is called a “creaming curve”, and cumulative reserves are graphed against time, the number of exploration wells, or the number of fields discovered. Here is the world creaming curve, presented as a function of number of fields discovered. The inflection of the curve shows that new field discoveries are progressively smaller and smaller.
Figure 4. The Global Creaming Curve. Horizontal axis is the number of fields discovered; the vertical axis is volume of reserves found. The dark green curve includes heavy oil; the light green curve does not. Red is gas; the blue curve is the cumulative count of exploration wells.
The creaming curve can also be presented in terms of time. The global curve shows less of an inflection, but it should be noted that extending the trend of new oil reserves requires progressively more effort for every barrels. I will present the creaming curve by discovery year, in order to forecast future discoveries by a given date. Let's look at the globe, region by region.
Figure 5. Creaming Curve for the Middle East.
The Mid-East shows a very mature creaming curve. The flattening of the cumulative discovered reserves shows a serious decline in the size of newly discovered fields. The light blue line, showing the number of exploration wells, shows that exploration effort has increased rather than decreased with time, but with progressively diminishing results. (Excuse me, I obscured the scale to modify the chart. There are about 4400 exploration wells.) The historic trend suggests that about 10 billion barrels of new reserves will be discovered in the Middle East by the year 2030.
Figure 6. Creaming Curve for Africa
Extrapolation suggests that 35 billion barrels can be discovered by 2030. Prospective areas include deep water in the Atlantic offshore, central African rift basins, deep water Mediterranean and frontier desert basins in Libya and Egypt.
Figure 7. Creaming Curve for Asia (without the former Soviet Union).
Extrapolation suggests 35 billion barrels of new reserves by 2030. Prospective areas include the South China Sea (currently the subject of territorial disputes between China and other SE Asian countries), deep water Indonesia, offshore Pakistan and India.
Figure 8. Creaming Curve for the Former Soviet Union.
Extrapolation suggests that 15 billion barrels will be discovered in the Former Soviet Union by 2030. Prospective areas include the Caspian region, central Asian countries (e.g. Turkmenistan), eastern Barents Sea, Kara Sea, eastern Siberia, sea of Okhtosk, and Siberian arctic and offshore. The large diversity of frontier geologic targets suggests to me that results might well exceed the historical trends. But available capital, transportation issues, and markets may impede the exploration of these remote places.
Figure 9. Creaming Curve for Europe.
Europe shows a very mature creaming curve. A relatively minor 5 billions barrels can be expected to be found by 2030. Future potential may be found in the deepwater Mediterranean, the western Barents Sea, west of Shetlands Atlantic margin, and in shale oil on the continent.
Figure 10. North American Frontier Creaming Curve.
Extrapolation suggests 17 billion barrels of new reserves by 2030. Prospective areas include the Eastern Gulf of Mexico (offshore Florida), deep water offshore southern California, Mexican and Cuban deep water Gulf of Mexico, the Alaskan arctic offshore, including the Chukchi Sea. Political and environmental issues are likely to prevent access to these areas for exploration and production for the foreseeable future.
Figure 11. Latin and South America Creaming Curve
South America has seen some of the largest discoveries in recent years, with supergiant oil fields recently discovered in the sub-salt play of Brazilian deep water, following on giant oilfields discovered in the deepwater Santos Basin in the previous two decades. Extrapolation of the current trend suggests that 50 billion barrels of new oil will be discovered by 2030. Some moderation of the trend is expected, as massive capital will be needed for the development of existing discoveries. Capital will primarily flow to development projects, rather than to additional exploration. Still, some exploration drilling will take place, and the knowledge gained from existing discoveries will aid in future exploration.
The total forecast of new discoveries by region adds up to 167 billion barrels by the year 2030.
Middle East 10
Africa 35
Asia (ex-Soviet Union) 35
Former Soviet Union 15
Europe 5
Eastern Hemisphere Subtotal 100 Billion Barrels
North America Frontier 17
Latin America 50
Western Hemisphere Subtotal 67 Billion Barrels
Figure 12. The Global Creaming Curve. Extrapolation indicates 170 billion barrels of new conventional reserves by the year 2030; or 200 billion barrels including heavy oil.
There is good agreement between forecast future discoveries by region and the total extrapolated from the global creaming curve.
The principle flaws or criticisms of extrapolation from creaming curves include: 1) The creaming curve represents only past experience, and doesn't include potential from new regions. Large oilfields might be found offshore Greenland, in parts of the Pacific, the Black Sea, the Arctic, or even in the Eastern Gulf of Mexico, 2) The creaming curve doesn't account for possible new exploration or production technologies, or 3) The creaming curve doesn't account for large volumes on unconventional resources, such as shale oil or tar sands.
It is possible that any of these, or some combination of these, may result in a reversal of historical trends, and that large and economic volumes of oil will be found and brought to market.
However, it is worth remembering that the historical record ALREADY includes discoveries and production from new regions, notably the revolutions of offshore exploration, deep water exploration, and arctic exploration. Substantial improvements in technology are also already part of the existing historical record. And while unconventional resources are only beginning to have a substantial impact on global production, realizing large gains from these resources will require the slow accumulation of financial and physical capital, and may be subject to limits in the availability of enabling resources, such as natural gas and water.
In sum, historical trends of exploration results (particularly on the global scale) form a legitimate basis for forecasting the volume of future oil discoveries.
As a final point, we should compare our forecast of new discoveries to the year 2030 to the volume expected to be produced through the year 2030. Global production in 2010 was about 31.7 billion barrels (about 87 million barrels per day). Assuming the IEA (International Energy Agency) estimate of 1.4% annual growth in production and demand, production in the year 2030 will total 41.9 billion barrels. And cumulative production from 2010 to 2030 will be 768 billion barrels.
Production to the year 2030 will exceed the volume of new reserves discovered by about 4-fold. There is no reasonable extrapolation of historical discovery trends that would allow reserve replacement on a global scale.
http://www.hubbertpeak.com/laherrere/bibliography.pdf
http://aspofrance.viabloga.com/files/JL_Sophia2010_part1.pdf
http://aspofrance.viabloga.com/files/JL_Sophia2010_part2.pdf


 Creativity is a deliberate process that clever people use to solve problems. Creativity is not taught in school; it is usually self-discovered. But it is clear that creative people have independently discovered the same process and are applying the same methods. Creativity can be learned, and it improves with practice.


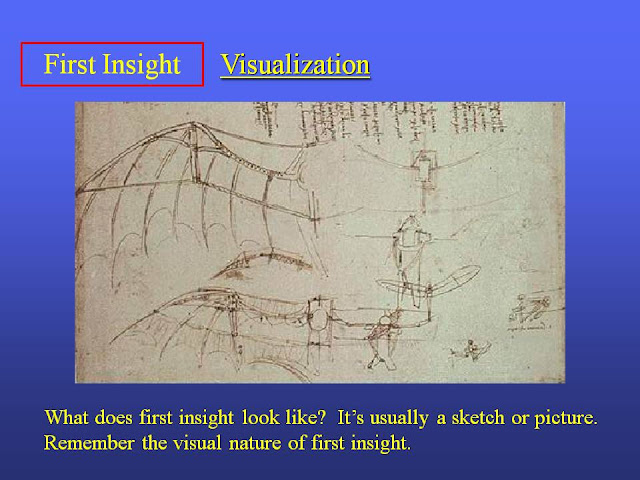
 The other part of a first insight is reducing that visual insight to a question. A questioning attitude is important for developing first insights, and framing a question the right way is critical to its solution. This is our first example of alternating between visual and analytical processes.
 What are you really trying to solve?